

Performance Testing Best Practices with Tricentis NeoLoad

Performance testing is crucial for ensuring applications can handle real-world usage, but it must be done right to yield meaningful results. This article distills key best practices, enriched with additional insights on effective load testing. We’ll cover how to mimic real-world conditions, plan and design tests, analyze results, and leverage Tricentis NeoLoad features – all to make your performance tests more realistic, efficient, and actionable.
Mimic Real-World Conditions for Meaningful Results
The #1 best practice is to design your tests to closely mimic real-world traffic and usage patterns. If your test doesn’t reflect production behavior, the results won’t be reliable real-world results. Achieving this involves more than just generating load – you need to replicate production-like environments and user behavior as much as possible.
-
Use Production-like Environments and Data: Ensure the test environment’s data volume, software version, hardware, and network setup mirror production conditions. For example, use a similar database size and user data; performance can vary with data size. Tests are most accurate when run on an environment that matches production’s architecture, configurations, and peak load conditions.
-
Simulate Actual User Behavior: Incorporate the think times, delays, and usage patterns that real users exhibit. In practice, real users do not perform actions back-to-back at machine speed – they pause to read, think, or navigate. We must introduce those delays (think time) and limit how frequently each virtual user repeats a transaction (pacing) to avoid unrealistic rapid-fire interactions. Many testers mistakenly ignore pacing and let virtual users iterate as fast as possible, but this “hammering” is not realistic – real users always have some gap between actions or sessions. Adding proper think time (e.g. a few seconds between page actions) simulates how a user reads and fills in data, and adding pacing (a delay between iterations) ensures you hit the intended transaction rate instead of overloading the system unrealistically.
-
Vary User Types and Conditions: Real-world traffic is heterogeneous. Some users are first-time visitors (empty cache), others are returning (with cached content); some are on fast networks, others on slow 3G connections. Your test should emulate this mix. For instance, NeoLoad lets you mark certain virtual users as “New” (empty cache) vs “Returning” users whose cache is warm – returning users won’t re-download cached resources. Likewise, use network simulation to throttle bandwidth and add latency for a portion of users (e.g. simulate 50% of users on 5G mobile and 50% on high-speed LAN). NeoLoad’s WAN Emulation feature can recreate network conditions with specific bandwidth limits, latency, and packet loss, so you can see how slower networks affect performance. By configuring multiple populations (groups of users) with different profiles, you can realistically split the load – for example, half the users use a desktop browser over broadband, while another large segment uses a mobile browser over a 3G network.
The closer your test conditions are to reality, the more confidence you can have in the results. This principle underpins all the detailed best practices that follow.
Build a Solid Performance Test Plan
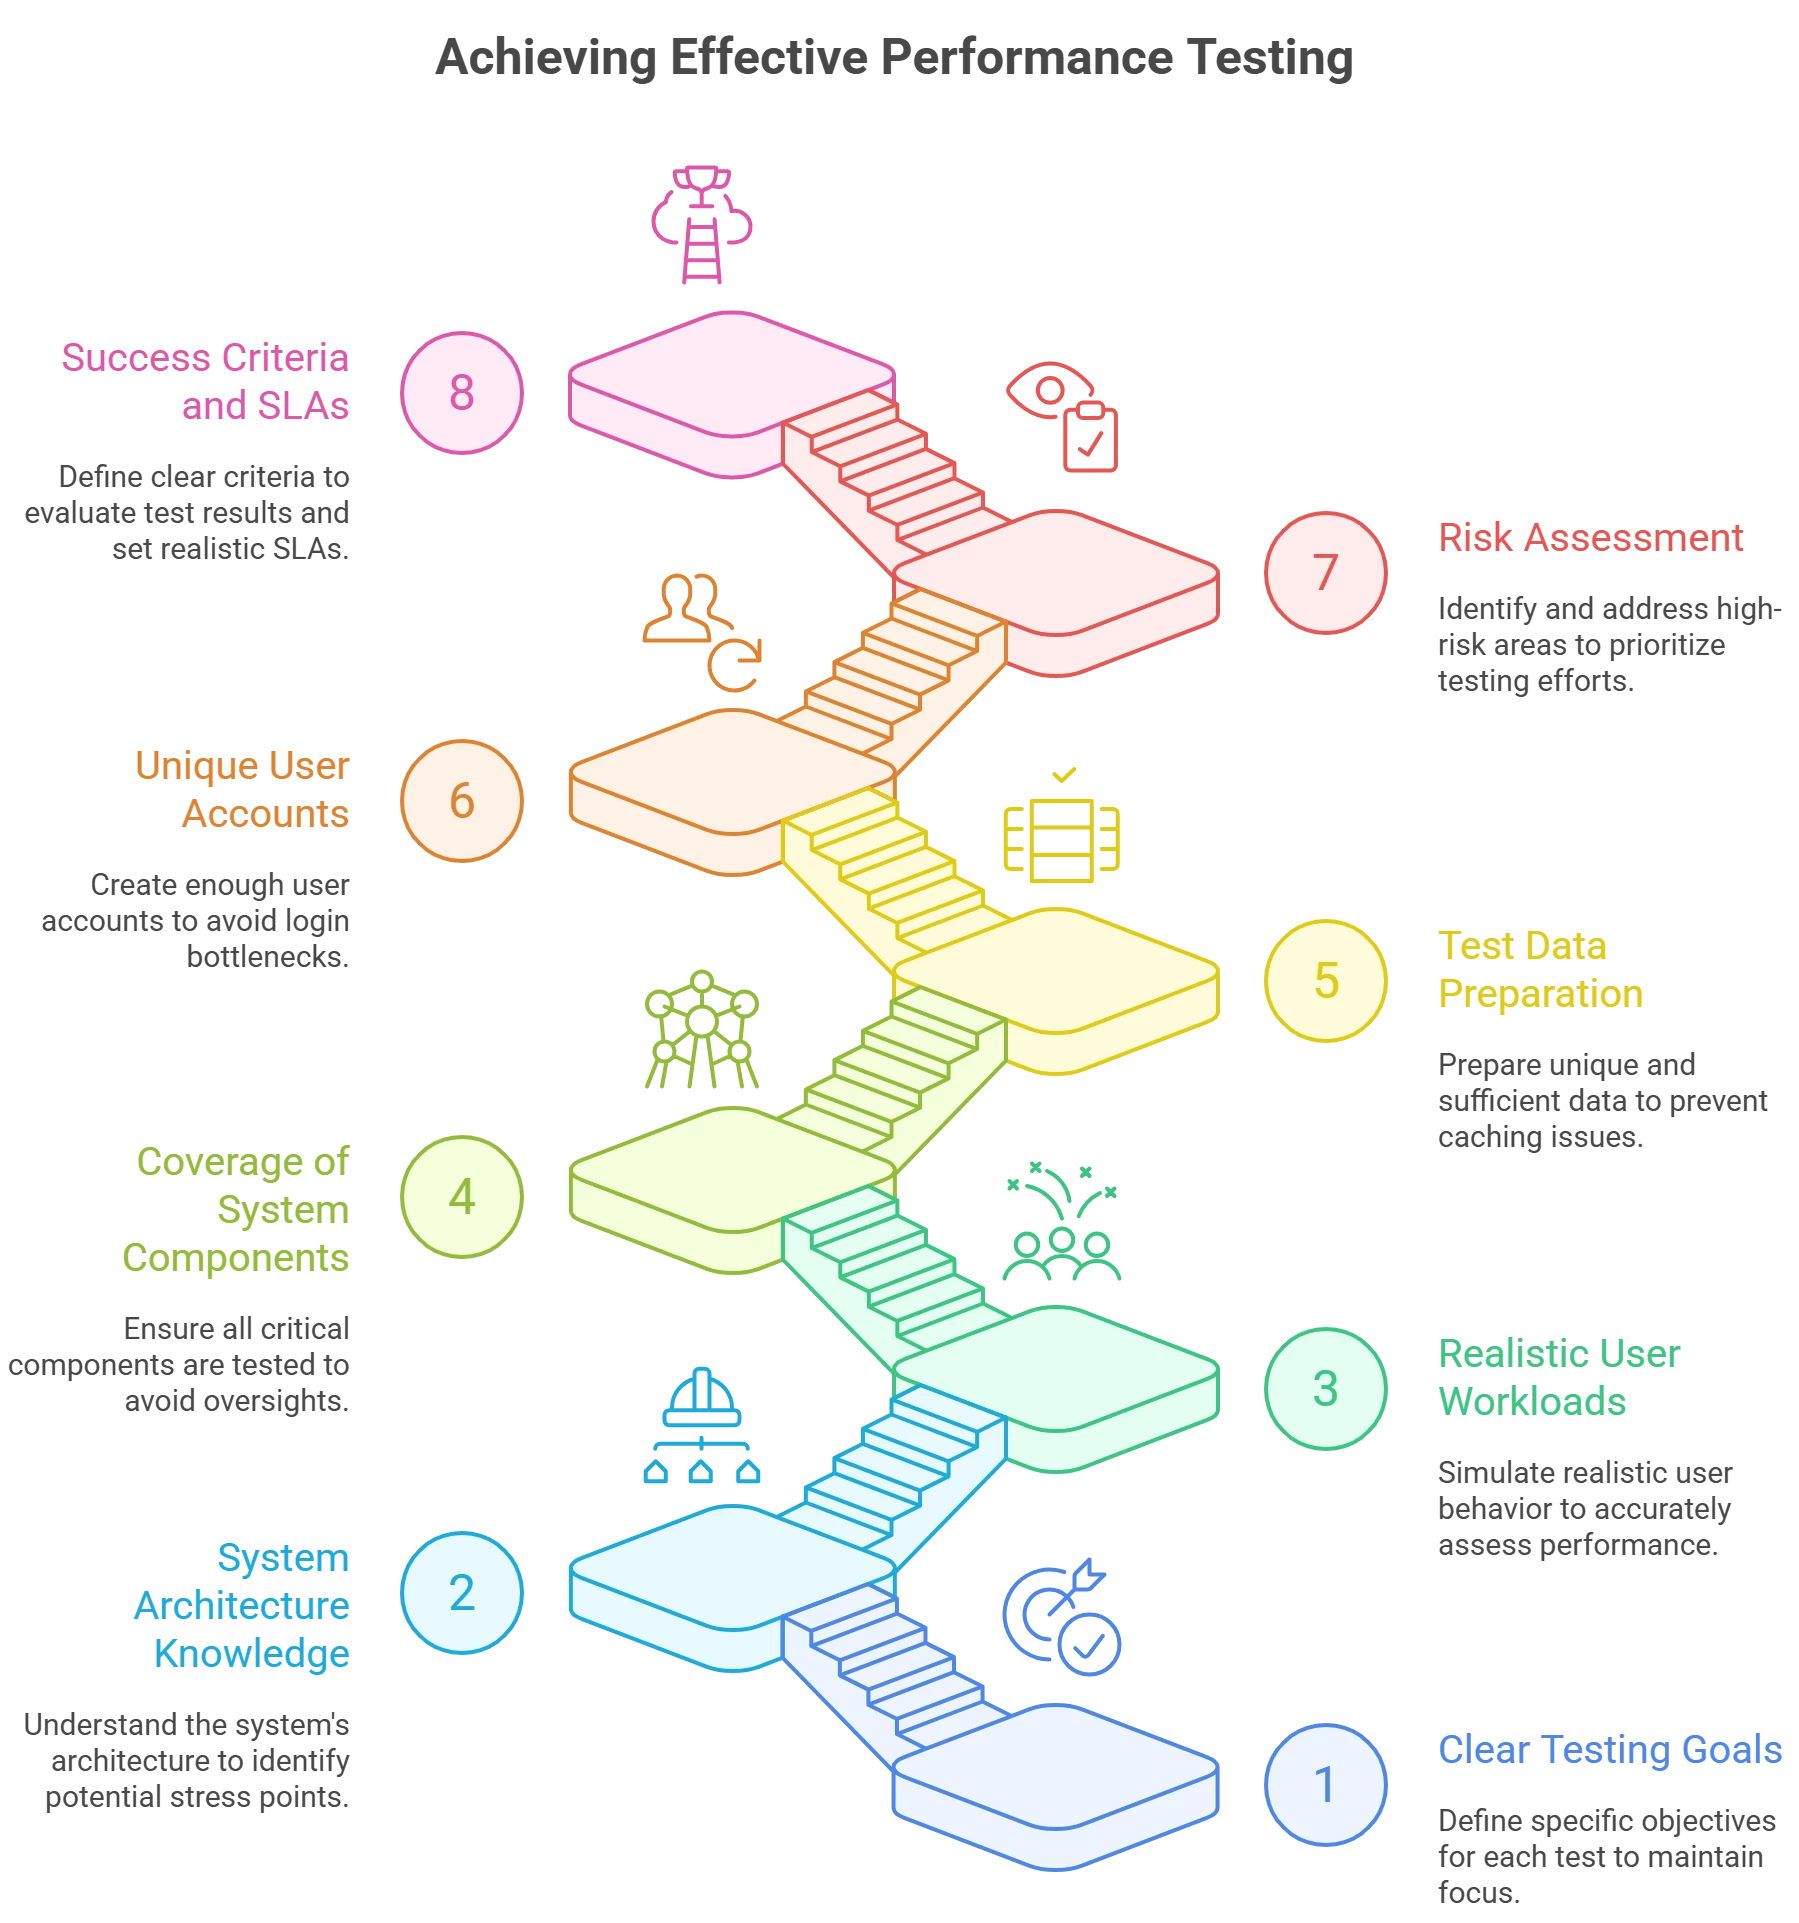
Good performance testing starts with good planning. Before diving into scripting or execution, create a test plan that defines what you will test and how. Key elements of a solid performance test plan include:
-
Clear Testing Goals: Every test should have a clear objective. Determine whether you are measuring baseline performance under expected load, stress-testing to find the breaking point, testing scalability, etc. Having multiple disparate goals in one test can cause loss of focus. It’s often better to run separate tests for separate goals than to combine too many questions into one. For example, you might first run a load test to see how the system handles 300 concurrent users (your expected peak load). If that passes with no issues, you could extend the same run into a stress test by gradually adding more users until something breaks. In this case, it’s acceptable to have a secondary goal (determining the breaking point) after the primary goal is met. Always document the goal(s) up front, as they will dictate how you design scenarios and what success criteria or metrics to focus on.
-
System Architecture Knowledge: Gain an understanding of the system under test’s architecture. It’s very useful to obtain an architectural diagram of the application and infrastructure. This helps you identify all components (web servers, app servers, databases, third-party services, load balancers, etc.) that might be stressed. Knowing the architecture allows you to plan appropriate monitoring (so you can observe each tier during the test) and anticipate where bottlenecks could occur. While you can conduct tests without it, having the architecture diagram is a best practice for troubleshooting and test design.
-
Realistic User Workloads (Load Profiles): Identify the key user journeys (business transactions) to simulate, and determine how many users (or what percentage of load) each will represent in the test. This often requires input from the business or production analytics. However, always sanity-check the numbers provided by stakeholders. Sometimes businesses overestimate (or guess) how frequently certain actions occur. Use your knowledge of the application and typical user behavior to verify if the load distribution makes sense. For example, if a business user claims an e-commerce site will process “billions of dollars in orders hourly” or that every user will perform a complex action daily, ensure those figures are realistic. In one case, testers recalibrated unrealistic load numbers given for an insurance app by considering how often a real customer would perform that action. Define each user path and its load profile clearly (e.g. 60% of users do a browse-and-purchase journey, 30% just browse, 10% admin actions).
-
Coverage of System Components: A smart addition to your plan is a User Path vs. Component matrix. List each user path alongside which backend components or services it touches. This matrix can reveal if any part of the system isn’t hit by your planned tests. If a critical component (e.g. a microservice or database table) isn’t covered by any test scenario, you might decide to add a user path or scenario for it, or at least note it as a risk not covered in this round of testing.
-
Test Data Preparation: Plan for unique test data and sufficient volumes of it. Re-using a small set of data for all virtual users can lead to cached results that mask true performance. For example, if every virtual user searches for the same item ID or logs in with the same account repeatedly, much of the data may be served from cache rather than hitting the database or backend systems. This yields artificially fast responses and misses the load on back-end components. Ensure your test plan includes creating or obtaining large data sets (customer accounts, order IDs, etc.) so each virtual user iteration can use fresh data and force a full back-end execution path. NeoLoad and similar tools allow parameterizing data; use that feature to vary inputs. It may take significant time to set up thousands of unique records, so plan that effort in advance.
-
Unique User Accounts: Similarly, ensure you have enough user accounts if your scenario involves logins. Many applications restrict an account to one active session, so a single username can’t be reused by 100 virtual users at once. If you only have a handful of test accounts, your test will fail or queue up logins. Prepare a large pool of test user accounts and credentials. If needed, use automation or scripts to create users in bulk (NeoLoad can even help create users if provided with the right interface or API).
-
Risk Assessment: Identify what aspects of the application pose the highest performance risk and ensure the plan addresses them. This includes complex transactions (e.g. an update operation that modifies a record will typically consume more CPU, memory, and database I/O than a simple read-only query). If certain features are new, resource-intensive, or known to be problematic, prioritize testing those early. A risk assessment might highlight, for example, that you haven’t yet tested a background batch process or a third-party integration – you can then decide to include it or at least monitor it during other tests. In the webinar, the presenter noted that update operations were more taxing than inserts, affecting performance significantly; such insights help allocate testing focus. Also, use the earlier component coverage matrix to list any untested components as risks – you might plan extra tests or watch those systems closely when other actions run.
-
Success Criteria and SLAs: Define how you’ll evaluate the test results. What response times or throughput are acceptable? Often this ties back to Non-Functional Requirements (NFRs) or service-level agreements. However, if you’re testing a brand-new system with no baseline, avoid setting arbitrary SLAs too soon. A best practice is to first run tests to gather baseline metrics and only later set SLAs based on realistic performance levels. In other words, use initial test results to establish what “good” looks like, ensure the system meets the business needs, and then enforce those numbers in subsequent tests. Setting an unrealistic SLA out of thin air can be counterproductive; instead, let the system’s demonstrated capability guide your targets. As the system matures and you iterate on performance tuning, you can tighten these targets.
A well-thought-out test plan might seem time-consuming, but it saves time in the long run. It provides a roadmap for your testing activities and prevents wasted effort (like testing with the wrong data, or missing a critical scenario until late in the project). It’s analogous to having a shopping list; you can go shopping without one, but you’ll likely make extra trips across the store and still forget something important!
Design Realistic User Paths and Scripts
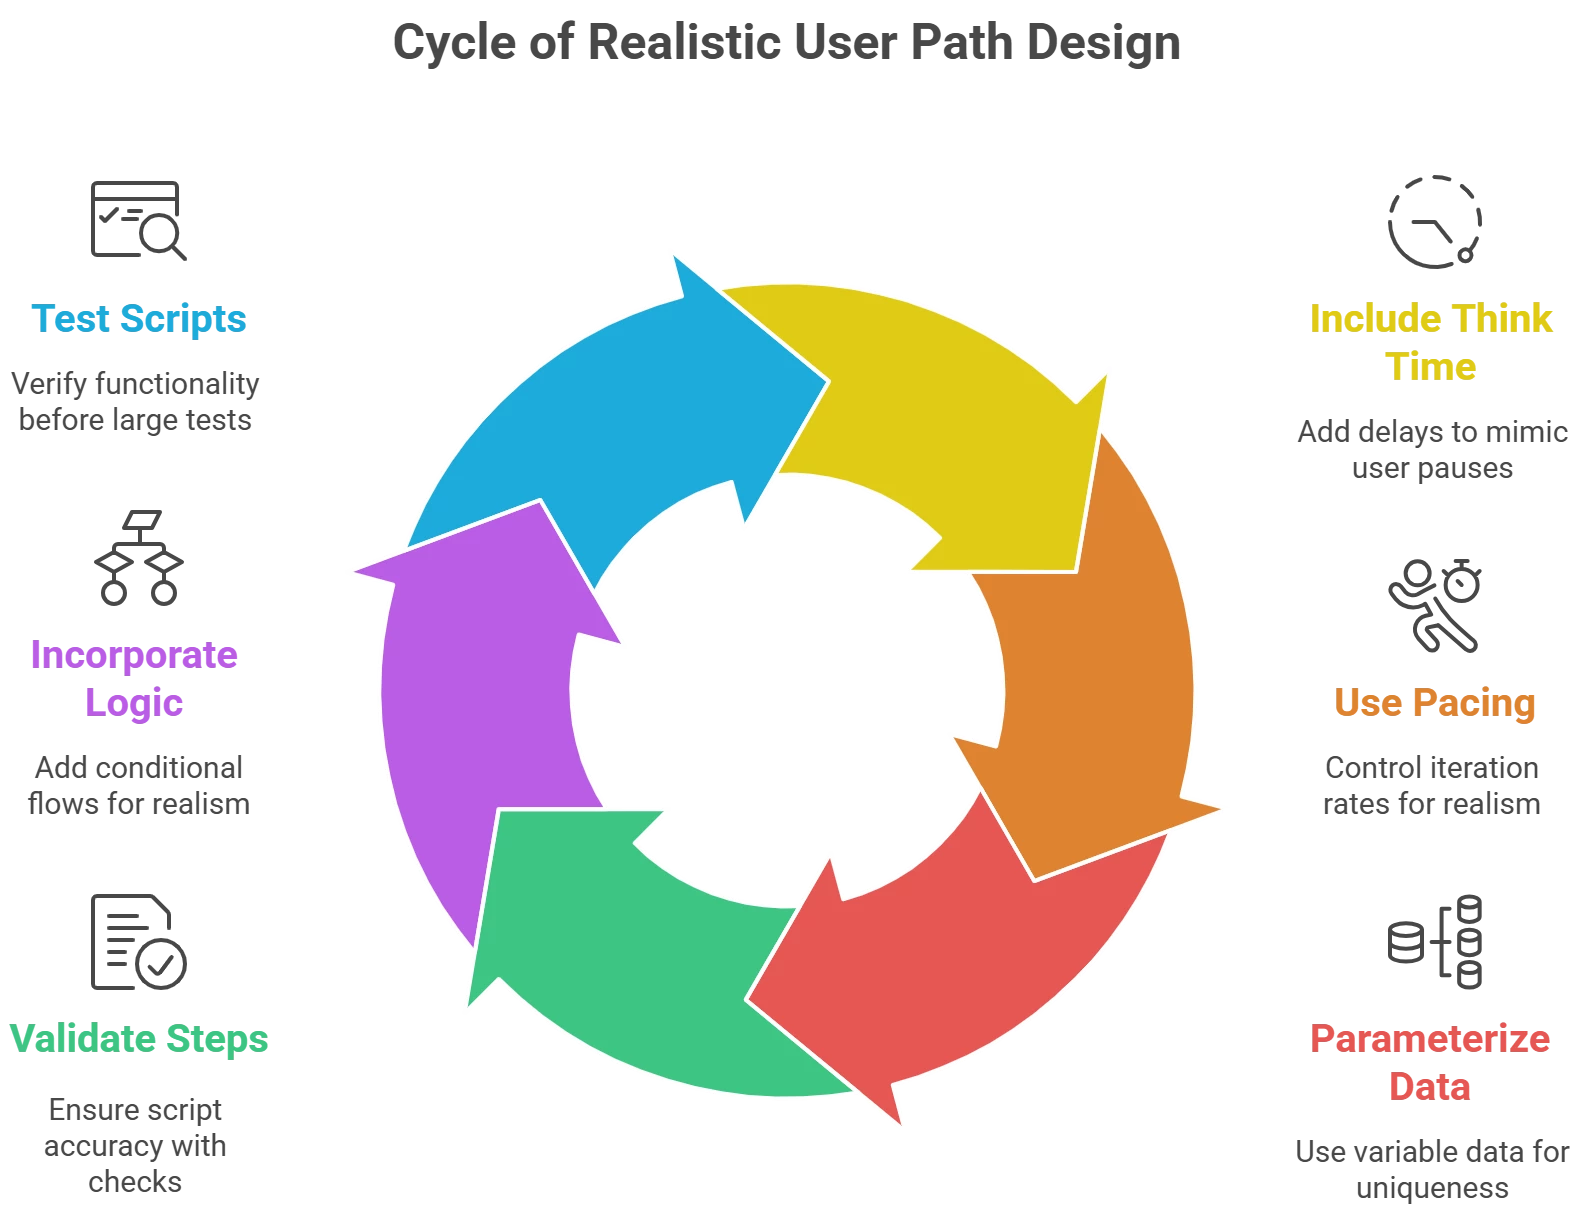
With a plan in place, the next step is creating the user path scripts (sometimes called test scripts or scenarios in other tools). Here, the goal is to accurately simulate how users interact with your application. Best practices for scripting include:
-
Include Think Time in Scripts: As mentioned, real users pause between steps – your script should too. Insert think times (delays) between page actions or API calls to emulate users reading or thinking. Tricentis NeoLoad allows adding a delay on each page or transaction, which effectively serves as the “think time” setting. Don’t use a one-size-fits-all delay for every step. Different pages or actions warrant different think times. For example, logging in might be quick, but filling out a complex form or reading a report could take a user much longer. In the webinar, it was noted that some testers make the mistake of using a flat 3-second delay everywhere, which doesn’t reflect reality. A better approach is to look at each page/screen and ask: how long would I or an average user spend here before proceeding? Some screens may need 1-2 seconds, others 10+ seconds of think time. Varying think time by page complexity keeps the script behavior realistic.
-
Use Pacing to Control Iteration Rate: Think time handles the delay within a single user session flow, but pacing controls the delay between iterations of that flow. Pacing ensures a virtual user doesn’t finish one iteration of the script and immediately start the next without a break. If you expect a real user to perform a certain action sequence only a few times per hour, you should enforce that in the script. For instance, if each virtual user represents an employee who would complete two transactions per hour, you might set the script to wait ~30 minutes before restarting the next iteration. NeoLoad supports pacing either via the runtime settings or by adding timers at the end of scripts. This prevents virtual users from looping too fast and generating unrealistic load (e.g. 1 user doing 100 checkouts in 5 minutes). Correct pacing is essential to hit target transaction rates and concurrency – it “regulates how often each user runs through a scenario, preventing unrealistic hammering of the server”.
-
Parameterize and Correlate Data: Each script should handle dynamic data properly. Parameterization means using variable test data (from the pools you prepared) rather than constants. For example, use a list of many customer names instead of one hard-coded name. This ties into avoiding cache hits as discussed earlier. Correlation is the process of capturing and reusing dynamic values that the server generates (e.g. session IDs, tokens, order numbers). Failing to correlate can cause the script to send invalid or duplicate data. The webinar highlighted a common mistake: testers sometimes correlate some, but not all, dynamic values, leading to a script that creates the “same thing over and over” instead of varied records. Always verify that your script is truly creating unique transactions. For example, if your test is supposed to create 1,000 new invoices, check that 1,000 distinct invoices were actually created – not one invoice repeated 1,000 times due to a correlation bug.
-
Validate Each Step’s Success: Build in validation checks to ensure the script is doing what it’s supposed to. Most load testing tools (NeoLoad included) allow you to assert that the server’s response contains expected data. Use these validations to catch errors or missteps early. For instance, after a “Login” request, verify that the response contains the text “Welcome” or the user’s account page content – this confirms the login succeeded. NeoLoad lets you check for the presence or absence of certain text, specific response codes, or response size thresholds. You might also check that no error message is present in the response (e.g. the HTML doesn’t contain “Error” text). These checks help ensure your virtual users aren’t silently failing. Additionally, do manual spot-checks outside the tool: if your script executed 1000 purchases, query the database or app to confirm those 1000 records exist with correct timestamps and details. Validating outcomes gives you confidence that the test is realistic and that when the system is under load, it’s processing actual transactions correctly, not just returning HTTP 200 OK for empty operations.
-
Incorporate Script Logic Carefully: Real user journeys can have conditional logic (e.g. 80% of users go to Page A and 20% go to Page B), random behaviors, or repetitions. NeoLoad supports adding loops, conditions, and even JavaScript or other logic to mimic these flows. Use these features to increase realism – for example, maybe 1 in 10 customers applies a promo code at checkout, so your script can pick a promo code from a dataset 10% of the time. Just be mindful to keep the scripts maintainable and not overly complex. Focus on the major variability that impacts performance.
-
Test Your Scripts Thoroughly: Before running them in a big load test, run each user path with 1 virtual user and verify it works end-to-end with no errors and the desired behavior. NeoLoad’s Check User Path feature (formerly “check virtual user”) is great for this – it runs the script and gives a detailed log of each request/response. Use it to ensure all correlations and parameters are working (no unexpected “object not found” or invalid data errors). Only when a script consistently passes and achieves the intended actions should it be used for large-scale tests. This one-by-one validation saves a lot of troubleshooting during actual test execution.
By carefully crafting your user path scripts with these practices, you set the stage for meaningful and trustworthy load test results. Your scripts are the users – make them behave like real users as much as possible.
Create Realistic Load Scenarios
With user path scripts ready, the next step is combining them into load test scenarios that exercise the system. This is where you define how virtual users are started, run concurrently, and stopped. Key scenario design best practices:
-
Stagger Ramp-Up (User Launch) Patterns: Don’t start all virtual users at exactly the same second unless that reflects a real event (which is rare). In reality, even if 1000 people are expected to be using the system by 9:00 AM, they will log in over a span of time (minutes or hours), not all at once. For example, in a company where everyone begins work at 8:00, not everyone hits the system at 8:00:00 – logins trickle in as people settle in. A very sudden ramp-up is an extreme worst-case that might overload systems in ways production never would. Instead, ramp up users gradually. NeoLoad allows you to configure ramp-up rate, such as start 10 users per second or spread 1000 user launches over 30 minutes. The webinar example mentioned a case where an off-the-shelf application had a bug: if two users tried to log in at the exact same moment, one would get kicked out. Only a test that ramped up too aggressively caught this. While it’s good that the issue was found, a controlled ramp-up helps identify the threshold where such issues occur without overwhelming the system from the start. Determine a realistic ramp pattern – e.g. X users per second – based on usage expectations, and configure your scenario accordingly. NeoLoad’s Advanced Scenario settings let you specify ramp-up in a stepwise or linear fashion.
-
Ramp-Down (User Exit) Patterns: Similar to ramp-up, avoid stopping all users instantly. If all virtual users end at the same moment, they might all free resources or commit transactions simultaneously, which can cause an unnatural spike. In production, users log off or finish gradually. It’s best to let users complete their ongoing transactions when a test ends rather than halting them abruptly. For example, if a user is midway through an order when the test’s scheduled duration ends, allow that user to finish the order. NeoLoad provides a Stop Policy setting for this. The recommended setting is often “indeterminate” or “graceful” stop, which allows virtual users to end their current iteration before stopping. A forced immediate stop can leave operations half-done (e.g. open sessions or partially updated records) and even corrupt data if the system isn’t designed for abrupt termination. By stopping users gradually or gracefully, you more closely emulate how a real system load would diminish (and you avoid artificial errors at test end).
-
Mix Different User Groups: In the scenario, include all the different user path types with the proportions determined in your test plan. For example, if you have three user profiles (e.g. browsing, purchasing, and admin tasks), you might run 70% of users as browsers, 25% purchasers, 5% admins. Tools like NeoLoad handle this via populations or percentages per user path. Make sure the math aligns with your target concurrency (e.g. 5% of 1000 users means 50 admin users). This mix should reflect production usage (as verified with analytics or assumed patterns).
-
New vs. Returning User Simulation: As noted, configure some virtual users as new (no cache/cookies) and others as returning (with cached assets) if your application’s performance is impacted by caching. NeoLoad’s population settings include a “Handle Cache” option with values like New or Returning. A returning user will reuse cached content (avoiding downloading images, CSS, JS again), while a new user starts fresh. In a real scenario, after the first visit, subsequent page views are faster thanks to browser cache. Simulating this can have a significant effect on observed response times and network load. For instance, you might set 20% of users as new (first-time visitors) and 80% as returning regular users. This way, the load test generates a realistic mix of cacheable and non-cacheable requests.
-
Network Bandwidth and Latency Simulation: Use network emulation to vary connection speeds among users. If your user base includes mobile users or remote offices, not everyone will have gigabit LAN speeds. Throttling some traffic to 3G, 4G, or adding latency can reveal performance issues (like if the app loads too slowly on a 3G connection due to large payloads). As a best practice, if your tool supports it (NeoLoad does), set up network profiles (e.g. LTE, DSL, dial-up) and assign them to a portion of virtual users. This ensures your server is tested not just under optimal network conditions but also under realistic slower links. It can also highlight front-end performance concerns that wouldn’t show on a fast network.
-
Background Load and Peak Considerations: Think about whether there are background processes or periodic spikes that should be in your scenario. For example, if every hour a batch job runs or an external system pulls data, you might simulate that with a separate thread or users that kick off at set times. Likewise, if lunch time is a peak in real life, you might have your scenario ramp up to a peak, hold, then ramp down, rather than a flat constant load. The idea is to shape the load pattern to mirror production usage patterns (if known).
-
Error Rate and Tolerance: Decide what error rate (if any) is acceptable during the test, and plan how to handle errors. Ideally, your script and scenario logic should stop on critical failures – e.g. if login fails, you don’t proceed to place an order – since a real user wouldn’t continue after an error. Monitor the error rate as the test runs. Some argue that a small percentage of errors (say 1%) is tolerable in a load test. However, consider that for the end-user experiencing the error, 0% is the goal. Any errors seen under load should be understood and explained. Maybe timeouts occur when load exceeds a threshold – that’s a clue to where the system’s limits are. Do not simply ignore errors because they seem “low”; investigate them. In our session, the expert remarked that while some teams dismiss a 1% error rate as acceptable, if you’re that unlucky 1% user, it’s definitely not okay. Use the load test to capture and identify the root cause of errors, then decide if they can be tuned out or are truly negligible.
Designing scenarios is an art of its own, and tools like NeoLoad provide a lot of flexibility. For example, NeoLoad allows very granular scheduling: you can start different groups of users at different times or even chain start conditions (one population can start after another finishes). It also has options for sequential vs. simultaneous user start, and advanced stop conditions. These features can model complex workload patterns, but even if you use a simpler approach, the core principle is to mirror the production load profile – initial ramp, realistic concurrency, mix of actions, and gradual ramp-down.
Effective Results Analysis and Reporting
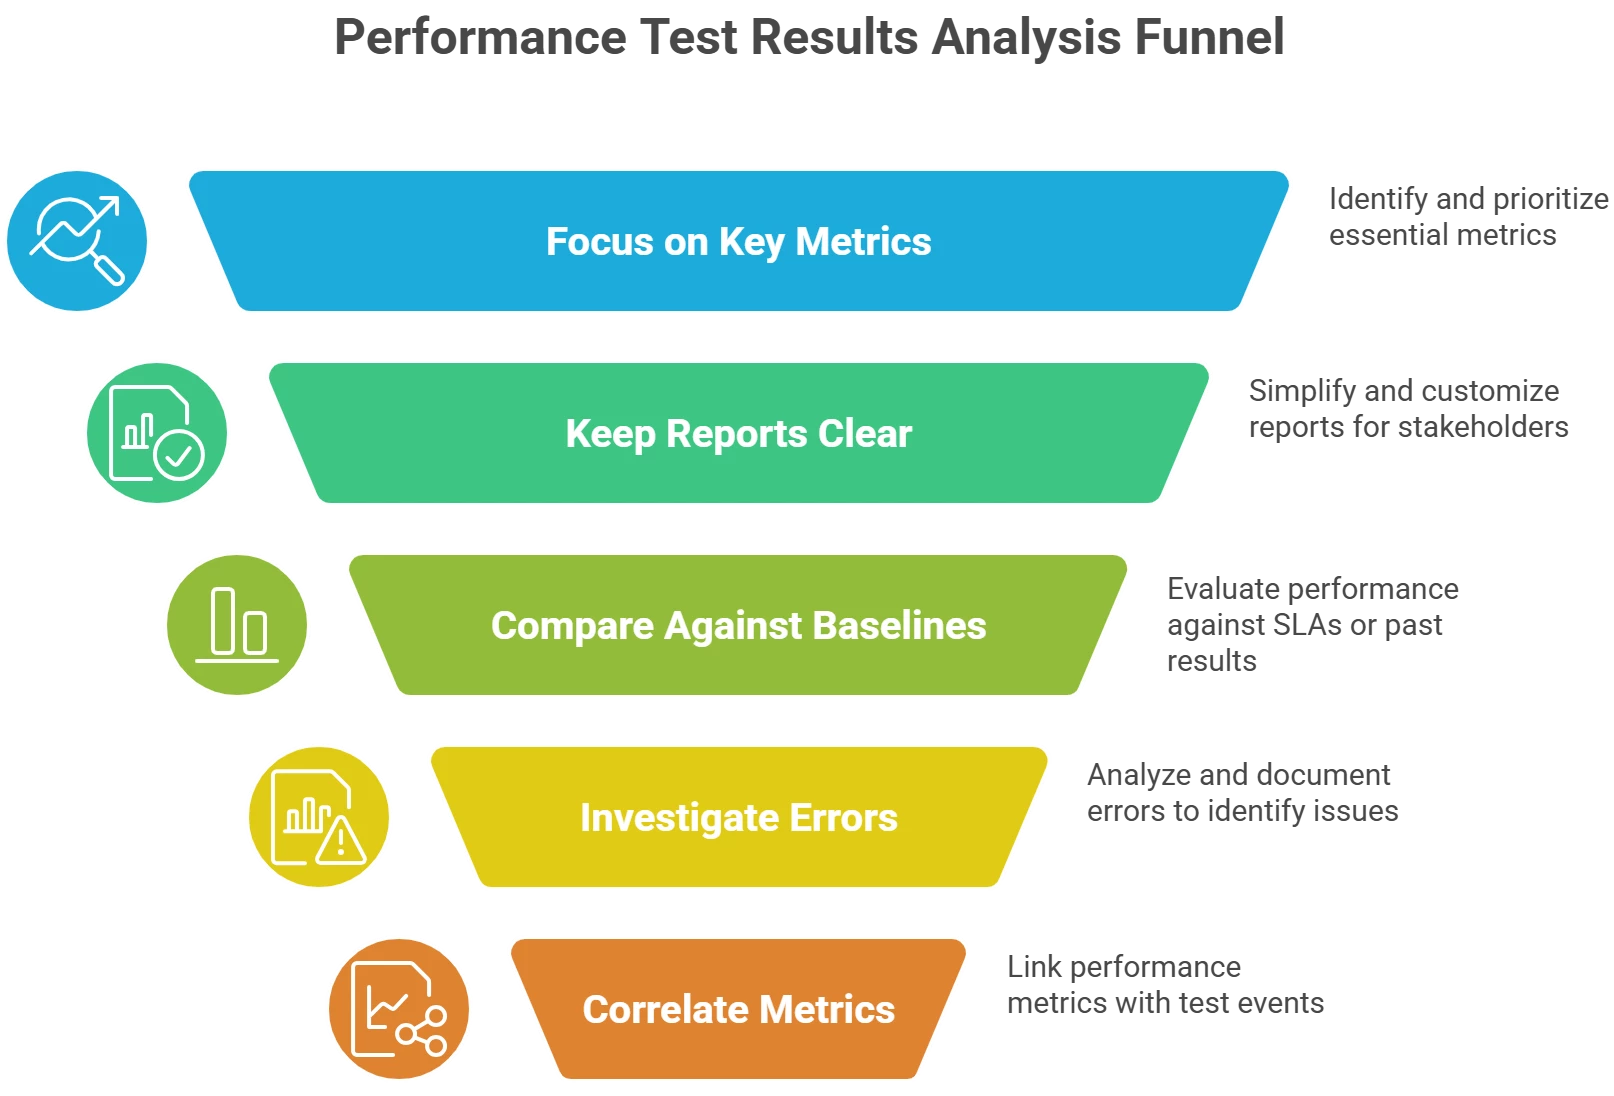
After executing a performance test, you’ll end up with a mountain of data: response times, throughput, error counts, system resource metrics, logs, and more. The best practice in results analysis is to focus on actionable insights aligned with your test goals, rather than getting lost in data. Here are some tips:
-
Focus on Key Metrics: At the test goal definition stage, you likely identified what metrics matter (e.g. page response times, transactions per second, CPU usage on server, etc.). When analyzing results, zero in on those. For instance, if your goal was “support 300 users with sub-2 second response time on search,” then the primary result to check is the search transaction’s response time distribution at 300 users. All other data (memory usage, network IO, etc.) are supporting evidence to explain why the response time was or wasn’t under 2 seconds.
-
Keep Reports Clear and Relevant: It’s tempting to include every graph and metric in a report to be thorough, but too much information can obscure the important findings. A best practice shared by the Tricentis experts is to limit the report to what stakeholders need. For example, a high-level report for management might just show user load vs. response time and highlight if targets were met, whereas a technical report for developers might include deeper diagnostics. Customize the level of detail to your audience, but in all cases, avoid information overload. Each chart or table in your report should have a purpose.
-
Compare Against Requirements or Baselines: If you have SLAs or previous test results, compare the new results against them. Did the latest code change improve or degrade performance? Are you within your acceptable limits? Trends over multiple tests are often more illuminating than a single test’s absolute numbers.
-
Investigate and Document All Errors: Any errors that occurred during the test should be analyzed. Check the error logs or failure details in NeoLoad (it will capture HTTP error codes or exceptions). Identify whether errors were client-side (tool limitations, script issues) or server-side (500 errors, timeouts). If, say, 5% of transactions failed due to timeouts, that’s a red flag – even if response times for the other 95% were fine. Document the error percentage and the likely cause. It might be necessary to rerun tests or run diagnostics to pinpoint the root cause.
-
Correlate Performance Metrics with Load: When analyzing, correlate the timing of performance slowdowns or errors with what was happening in the test. For example, did response times spike after you hit 250 users? Did CPU on the app server reach 90% at the same time? Tools and results should be used in combination – for instance, overlaying a graph of active users with one of response time can show at what load the system starts to struggle.
-
Leverage NeoLoad’s Results Metrics: NeoLoad provides built-in analysis for results, including percentile charts (to see 90th/95th percentile response times), average vs. time graphs, and breakdowns by transaction. Use these to identify any specific transactions or pages that are slower than others. Perhaps login is fast but checkout is slow – that directs you where to optimize.
-
Export Data for Deeper Analysis if Needed: In some cases, you may need to export raw results to Excel or a monitoring tool for deeper crunching. For example, if you suspect a memory leak, you might export the server’s memory usage data and examine it closely or compare multiple test runs.
Ultimately, a performance test report should tell a story: Given X scenario, the system achieved Y performance. Here were the bottlenecks or limits observed. Here are recommendations or next steps. By focusing on the salient points and backing them with data, you make it easier for stakeholders to understand and act on the results.
Team Skill Sets and Roles in Performance Testing
One often overlooked aspect of performance testing best practices is having the right people with the right skills involved. Performance testing is a multidisciplinary effort, and different roles bring different expertise. In smaller teams one person might wear multiple hats, but understanding these roles helps identify any skill gaps. The session outlined three primary roles:
-
Performance Tester (Script Developer): This role focuses on creating and executing the user path scripts. Key skills include understanding web protocols (HTTP, REST, etc. or other protocols like SAP GUI, Citrix, etc. depending on the application) and being able to debug the request-response flow. A performance tester correlates dynamic values, parameterizes inputs, and adds script logic as needed. They should be somewhat technical – comfortable looking at server responses, perhaps reading logs or basic code – to ensure the script is working correctly and to interpret whether the responses are valid. They don’t necessarily need deep system architecture knowledge, but they do need to know the tool (NeoLoad in this case) and the basics of how the application communicates. Often, the performance tester is the first to encounter issues (for example, a particular API call always fails under load) and needs to distinguish script problems from system problems. Attention to detail, especially with correlation and data, is a critical skill here.
-
Performance Engineer: This role is a step up in breadth. A performance engineer typically designs the overall performance test scenarios and strategies, configures the test environment, runs the tests, and performs initial analysis and troubleshooting. They work closely with stakeholders to review requirements and create the test plans and workload models. During execution, the performance engineer monitors the system under test, checks that scripts are functioning, and investigates any errors or bottlenecks that appear. They often have knowledge of infrastructure, databases, and application servers – not to the level of an admin, but enough to understand system metrics and logs. The performance engineer serves as a first line of support for the performance testers/script developers; if a script is failing or an error is observed, they help figure out why. They also verify that the scripts truly simulate the intended actions (double-checking that correlations are done, etc.). In many teams, the performance engineer is the central coordinator of performance testing activities.
-
Performance Architect (Performance Specialist): This is a senior role, often filled by someone with extensive experience (10+ years in performance testing). The performance architect looks at the big picture of application performance. They review the entire system architecture before tests are run, identifying where performance risks might lie. For example, they might flag that a certain component could be a bottleneck or that the database indexing strategy might not scale. They ensure the test plan is comprehensive and that it aligns with business risk areas. During test design and review, they catch flaws (e.g. “We’re not testing the payment service at all – that’s a risk!”). When results come in, performance architects interpret them in terms of the end-user experience and business impact (“if response time for checkout is 5 seconds, what does that mean for customer drop-off?”). They are also deeply involved in troubleshooting complex issues: because of their broad knowledge, they collaborate with system admins, developers, DBAs, etc. to pinpoint root causes of performance problems. In a support hierarchy, the performance architect is the Level 2 or escalation point when the performance engineer cannot resolve an issue. This role benefits from solid understanding of networks, databases, OS, and application internals – essentially bridging the gap between testing and systems engineering.
In practice, teams might not have all three distinct titles. You may simply have “performance testers” and perhaps one lead who acts as the architect. The important takeaway is to ensure the skill sets are covered. If your team lacks deep system knowledge, involve a system administrator or developer when analyzing results. If scripting skills are weak, invest in training on the load testing tool and technologies (e.g., how to handle OAuth tokens or correlate SAP GUI IDs). During the session, it was noted that many performance issues get missed because the team didn’t have the right expertise to design or interpret the tests. Address this by educating and upskilling the team members on areas they are not familiar with. For example, a tester skilled in functional testing may need mentoring to understand HTTP traffic and debugging. Building a cross-functional performance team, or at least a network of contacts (DBA, network engineer, etc.), will greatly enhance your performance testing practice.
Finally, encourage a culture of continuous learning. Performance testing often uncovers surprising behaviors, and troubleshooting them increases everyone’s knowledge. The webinar speaker mentioned that even if you start without being a database expert, each performance test you conduct will teach you more about how databases behave under load, how networks can impact throughput, and so on. Over time, this experience is what develops someone into a performance architect. So keep learning from each test result and issue – your team’s skills will grow with each challenge tackled.
Integrating Performance Testing into CI/CD Pipelines
In modern DevOps practices, performance testing is not a one-time event but a continuous process. Ideally, you want to integrate performance tests into your CI/CD (Continuous Integration/Continuous Delivery) pipeline so that performance regressions are caught early and often. Tricentis NeoLoad supports several integration methods, and the expert session provided guidance on this:
-
CI Integration Approaches: NeoLoad offers a few ways to run tests via CI tools like Jenkins, Azure DevOps, GitLab CI, etc. One common method is using the NeoLoad plugin for Jenkins (and similar plugins for other tools). This plugin essentially triggers tests using NeoLoad’s built-in APIs. However, an observation from the field is that the Jenkins plugin (which uses NeoLoad’s GUI-driven REST API) doesn’t expose all capabilities – for example, it might not allow you to programmatically stop a test on certain conditions. It provides a straightforward integration but at the cost of some flexibility.
-
Using NeoLoad Web APIs and CLI: For more control, Tricentis provides a NeoLoad Web API and a command-line interface (CLI) (often Python-based) to interact with NeoLoad programmatically. The recommended approach for robust CI/CD integration is to use the NeoLoad CLI (Command Line Interface), which internally leverages the NeoLoad Web APIs. By installing the NeoLoad CLI (a Python package), you gain the ability to start tests, stop tests, check test status, and even pass test definitions via the command line or scripts. This means any CI tool can invoke NeoLoad tests simply by running these commands (no fancy plugin needed, though plugins can simplify it). The CLI supports defining tests as code – for example, you can use YAML files to configure test scenarios, which makes versioning and maintaining performance tests similar to code development. In summary, the CLI/Web API method gives full control: you can start a test, monitor it, decide to stop it if certain conditions met (something not possible through the basic plugin).
-
Example – Stopping a Test via CI: One scenario discussed was how to stop a running test from Jenkins if a problem is detected. With the out-of-the-box Jenkins plugin, there was no direct “Stop test” call exposed. A creative workaround was to use NeoLoad’s APIs within the test script itself – for instance, the script could periodically check for a flag (like existence of a file) and gracefully stop virtual users if the flag is present. But using the NeoLoad CLI, you could simply call a stop command from Jenkins when needed. This illustrates why having the richer API access is helpful.
-
Automate Early, Test Often: Integrating into CI means you can run smaller-scale smoke tests or component performance tests regularly (even daily) rather than waiting for a big bang test at the end. For example, every time a build is deployed to a test environment, you might run a quick 50-user test for key transactions and have the pipeline flag if response times exceed a threshold. NeoLoad’s automation interfaces make this feasible, and you can trend results over builds.
-
Resource Considerations: When running in CI, ensure the machines running the load (load generators) are available and the environment is set up in a consistent state. You might use cloud-based load generators for flexibility. Also, plan test durations to fit pipeline timing – long soak tests might not run on every code check-in, but could be scheduled nightly or in a separate pipeline.
In short, treat your performance test configurations as code and integrate them just like you do functional tests. The NeoLoad expert recommended leveraging the newer NeoLoad Web APIs and the Python CLI for the most powerful CI/CD integrations. This ensures that continuous performance testing can keep pace with continuous delivery.
Monitoring and Troubleshooting Performance Issues
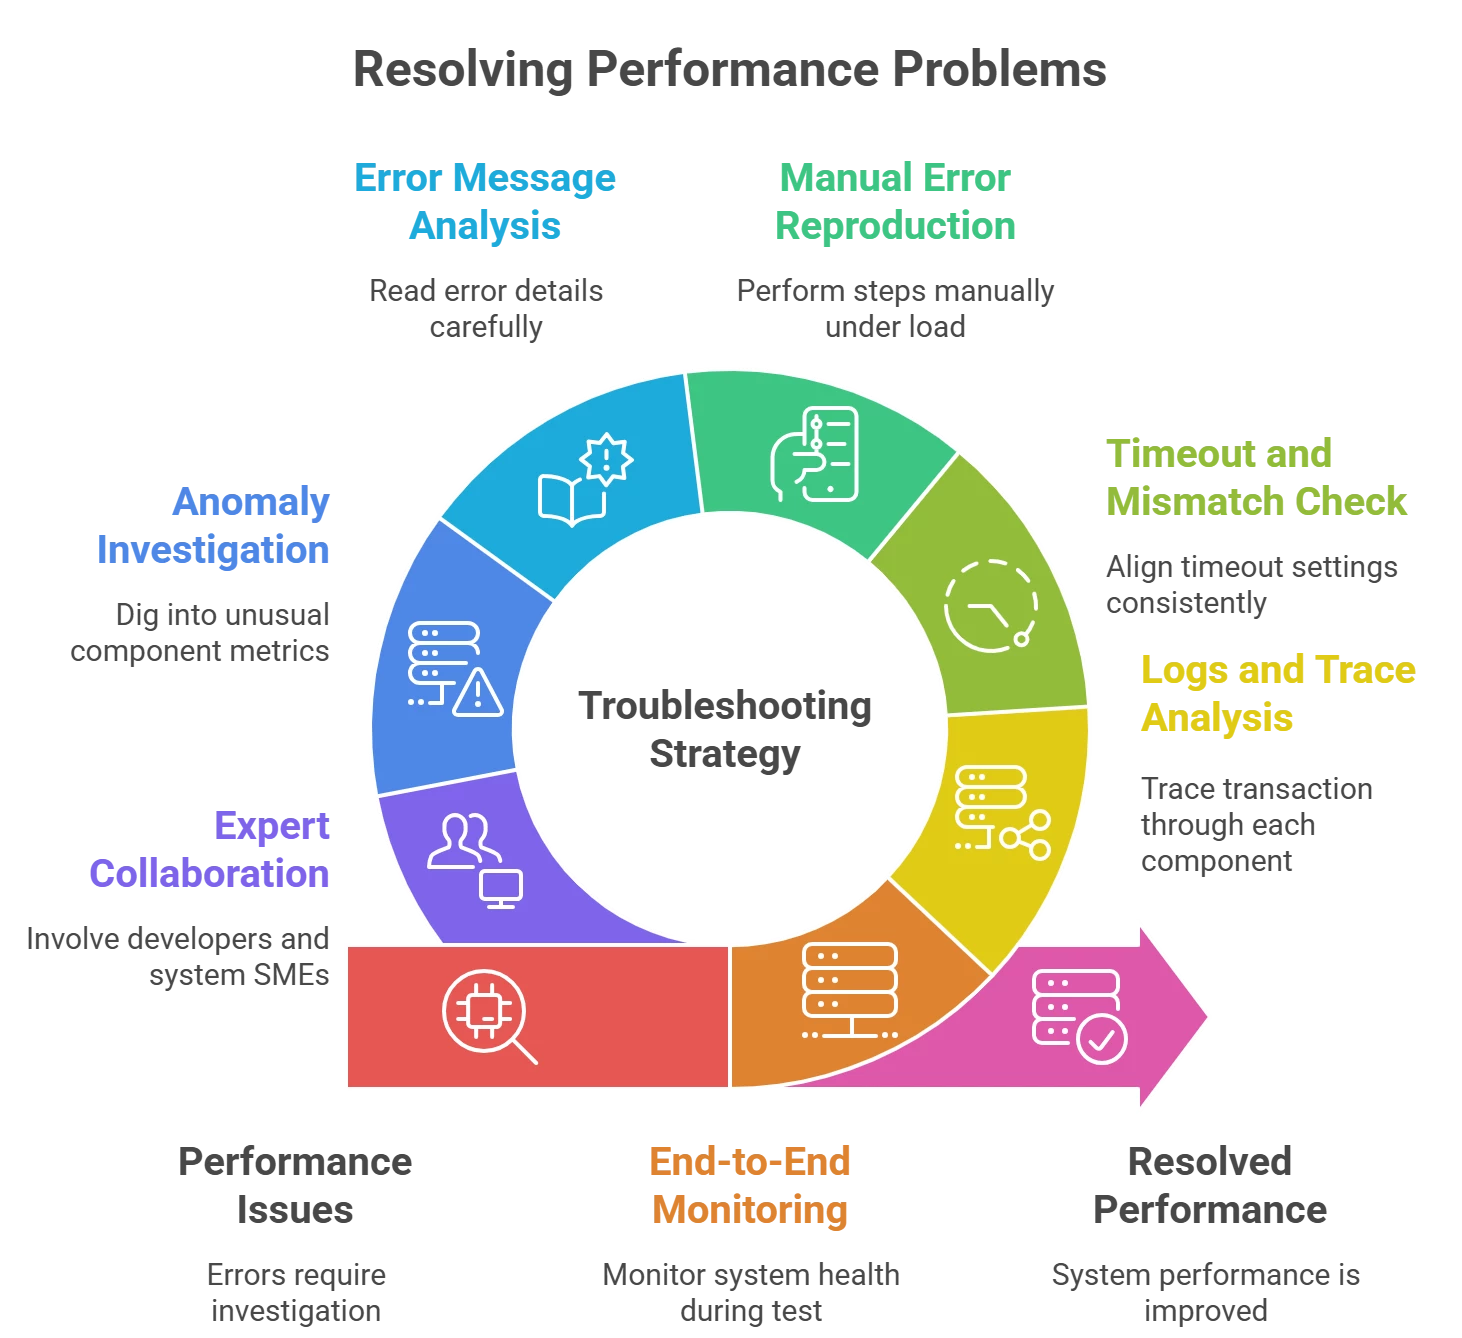
No matter how well you design tests, you’ll eventually encounter performance issues or errors that require investigation. Having a strategy for monitoring and troubleshooting is a best practice to actually resolve the performance problems your tests find:
-
End-to-End Monitoring: Always monitor the system under test’s health (CPU, memory, disk I/O, network, etc. on all relevant servers) during the test. NeoLoad can integrate with monitoring tools or you can use APM (Application Performance Management) tools – the key is to collect resource metrics correlated with the load test timeline. Start monitoring a few minutes before the test and continue for a few minutes after the test. This pre- and post-test monitoring helps establish baseline idle resource usage and whether the system returned to baseline after the test. If, for example, memory usage climbs during the test and never comes back down, that indicates a potential memory leak or other resource leak. Monitoring before/after can catch this.
-
Logs and Trace Analysis: When errors occur, or when performance is slow, go through the chain of systems to pinpoint where the problem lies. A systematic approach is to trace a sample transaction through each component. Check the load balancer logs to see if the request hit it, then the web server/application server logs to see if it was processed, then database or downstream service logs. The webinar speaker described this as following the “message” through the system. If a request fails or is slow, determine: Did it reach the server? Did the server send a query to the DB? Which step took longest? This way, you can isolate whether the bottleneck is in the network, web server, application logic, database, external API call, etc.
-
Pay Attention to Timeouts and Mismatches: A common issue is inconsistent timeout settings. For example, a web server might time out after 30 seconds waiting for a response from an app server, but the app server actually takes 35 seconds to complete a task – causing the web server to abort early. The user sees a failure even though the backend eventually did the work. One real example given was a load balancer that had a shorter timeout than the web server behind it, leading to responses arriving after the client already gave up. Recognizing these situations can explain odd errors. The fix might be to align timeout settings or optimize the slow operation.
-
Reproduce Errors Manually if Possible: If your script is seeing an error that’s hard to understand, try performing the same steps manually through the application (if feasible) while the system is under load. Sometimes certain error messages or behaviors are only obvious in the real UI. For instance, under load the application might throw a popup saying “Server busy, try again later” – something your script might just register as an HTTP 500 error without context. By using the application as a real user during the load test, you might catch these qualitative clues. The presenter noted this technique helped him see differences in behavior that automated scripts didn’t show.
-
Read Error Messages and Look for Patterns: It sounds obvious, but always read the error details carefully. Check if errors are consistent or random. Do they occur only after a certain duration or at a certain concurrency level? For example, you might notice that a specific error spikes every 60 seconds – which could hint at a scheduled job conflict or a cache eviction cycle causing it. Or perhaps errors start after ~500 users are active – suggesting a resource saturation at that point. Noting patterns (every 30 seconds, or every user iteration, or only on one of the servers) provides valuable clues. Also, differentiate error types – timeouts vs. validation failures vs. connection refusals each point to different problem sources.
-
Don’t Ignore “Small” Anomalies: If one component’s metrics look unusual (e.g. CPU on one server is much higher than others, or one type of request has a few failures), dig in rather than writing it off. Small problems in testing can magnify in production. It’s better to understand and explain every deviation if possible.
-
Involve Developers/System SMEs: If an issue is beyond your expertise (say, a memory leak in the Java heap or a slow database query), involve the developers or system administrators. Share the load test findings, logs, and timelines. Collaboration often speeds up solving performance problems.
Troubleshooting is part detective work, part experience. The more you troubleshoot, the more patterns you recognize. As the expert said, over years of testing you learn that “when I do X, Y is going to happen” in systems. Following these best practices will sharpen your ability to diagnose and fix the performance issues that your testing uncovers, ensuring that each test not only measures but also helps improve the system.
Conclusion and Next Steps
By adhering to these best practices – from thorough planning and realistic scenario design to continuous integration and careful analysis – you can significantly improve the effectiveness of your performance testing. Remember that tools like Tricentis NeoLoad are there to implement your strategy: use features like think time, pacing, populations, and monitoring to their fullest to mirror reality. Performance testing is not just about hitting a system with load, but doing so in a smart, methodical way and learning from the results.
As you put these tips into practice, you’ll build confidence that your application can handle real-world usage and provide a great experience to users even under stress. Performance testing then becomes a proactive activity that guides architecture and development decisions, rather than a last-minute hurdle.
For a deeper dive and to see these principles in action (including a live demo of NeoLoad configurations), we encourage you to watch the full webinar from Tricentis Academy: Tricentis Expert Session: Performance Testing Best Practices using Tricentis NeoLoad. In the session, experts Raoul DeLeon and Brian Billingsley share their decades of experience and practical tips to help you succeed in your performance testing journey. Happy testing!

