


Modern QA and DevOps teams are increasingly shifting performance testing to the left – executing load tests earlier in the development cycle to catch issues sooner. Integrating Tricentis NeoLoad into continuous integration (CI) pipelines makes this possible by automating performance tests as part of your build and deployment process. In this article, we’ll explore how to use NeoLoad with CI pipelines (as highlighted in the Tricentis Expert Session webinar on this topic) and cover key insights from the webinar’s technical demo. We will discuss why early performance testing is important, how the NeoLoad CLI enables CI integration, a recap of executing NeoLoad tests via command line and Jenkins, GitOps-style management of test assets in source control, automating test analysis/reporting, and best practices to achieve scalable, continuous performance testing in your pipelines.
Why Shift-Left Performance Testing Matters
Traditionally, performance testing was done late in the software lifecycle, but this often meant that issues were discovered right before release – or worse, in production. The shift-left testing approach moves performance testing earlier into the design and development phases. By doing so, teams can identify and fix performance bottlenecks long before code reaches production. For example, developers can use the NeoLoad Command Line Interface (CLI) to run performance tests during development, helping them spot slowdowns and optimize code early on. Catching performance issues sooner not only reduces the cost and effort to fix them, but also prevents nasty surprises late in the release cycle.
Integrating NeoLoad into your CI pipeline enables continuous performance testing on every code change. Instead of treating load testing as a one-time QA phase, it becomes a continuous feedback mechanism. Each commit or build can trigger an automated NeoLoad test to evaluate how the latest changes impact application speed and stability. This immediate feedback loop means any performance regression is detected within minutes, allowing developers to address it right away rather than after a lengthy test cycle. In short, early and frequent performance testing (powered by CI automation) leads to faster feedback, more reliable releases, and higher confidence in your application’s behavior under load.
NeoLoad CLI: Enabling CI Integration for Performance Tests
A cornerstone of integrating NeoLoad with CI tools is the NeoLoad CLI. NeoLoad’s command-line interface is a lightweight tool (packaged as a Python-based client) that interacts with the NeoLoad Web platform to run tests programmatically. In essence, the CLI allows you to control NeoLoad from any environment that can execute commands – whether that’s a developer’s machine, a Jenkins agent, or a Docker container in your pipeline. By using the CLI, teams can script performance test execution as part of automated workflows, without needing to open the NeoLoad GUI.
How the NeoLoad CLI works: The CLI acts as a client to NeoLoad Web’s runtime API. You first authenticate the CLI against your NeoLoad Web platform (either SaaS or on-premise) using an API token. Then, via CLI commands, you specify the test to run – which can involve: creating or selecting a test definition (test scenario) on NeoLoad Web, uploading the latest NeoLoad project or test script, and finally launching the test execution. All of this can be done with a sequence of commands (or a single combined command) in an automated script. For example, after installing the CLI (pip3 install neoload), one might run a series of CLI commands to log in, set test parameters (like test scenario name, duration, number of virtual users, etc.), upload the test assets, and start the test run. The CLI defaults to using NeoLoad Web for orchestrating the test, which means the heavy lifting (load generation, result aggregation) is handled by NeoLoad’s infrastructure – perfect for CI environments where you want tests to run headlessly in the background.
One of the key reasons the CLI is ideal for CI/CD is its flexibility and scripting capability. Because it’s a text-based interface, it can be used in any CI tool that can execute shell commands or scripts. Tricentis provides preconfigured examples for popular CI systems like Jenkins, Azure DevOps, and GitLab CI to help you get started quickly. In practice, you can integrate NeoLoad into your pipeline either by calling the CLI in a shell step (e.g., a Jenkins pipeline sh step or a GitLab CI script block) or by using dedicated plugins/integrations when available. (NeoLoad has a Jenkins plugin, for instance, but using the CLI directly offers more control and is CI-agnostic.) The CLI also supports passing dynamic parameters at runtime – for example, you could pass a different test duration, environment URL, or number of users based on pipeline variables – allowing the test to adapt to the context (dev, QA, staging, etc.) in which it runs.
Demo Recap: Running NeoLoad Tests from the Command Line and Jenkins
In the webinar’s technical demo, Tricentis experts showed step-by-step how to execute a NeoLoad performance test both locally via the command line and within a Jenkins CI pipeline. This demonstrated how seamlessly NeoLoad fits into automated workflows:
- Running a test from the command line: The presenter first used the NeoLoad CLI on a terminal to run a simple load test. They had a NeoLoad test scenario (either created through the NeoLoad GUI beforehand or defined as-code in YAML) and executed it with a CLI command. This involved logging into NeoLoad Web (with an API token), selecting the test scenario, and launching the test. In a real-world scenario, this could be as simple as a one-liner chaining several neoload CLI subcommands (login, test-settings, project upload, run) to kick off the test. The CLI output in the console would show the test starting, and one could follow the progress or check NeoLoad Web for live results. The key takeaway is that any engineer can trigger a performance test on-demand using a CLI call – no manual UI steps needed – which is perfect for embedding in scripts and pipeline jobs.
- Integrating NeoLoad into a Jenkins pipeline: Next, the demo showed how to include the NeoLoad test execution as an automated stage in a Jenkins pipeline. In Jenkins, you can invoke NeoLoad in two main ways: (1) via the NeoLoad Jenkins plugin, which provides a dedicated pipeline step (neoloadRun) to execute a NeoLoad scenario, or (2) by calling the NeoLoad CLI in a shell step. The webinar demo used the latter approach, illustrating how a Jenkinsfile can call the NeoLoad CLI. For example, the Jenkins pipeline might have a stage like “Performance Test” that contains a shell command to run the same CLI sequence used locally.
In this pipeline script, Jenkins would call the NeoLoad CLI to import or reference the test project and then execute the test. You could parameterize the pipeline to pass in variables (for instance, the test environment URL, or the Git branch, etc.) which the CLI can use (perhaps via a YAML config or command-line options) to customize the test run for that build. The NeoLoad CLI interacts with NeoLoad Web to start the test using available load infrastructure (controllers and load generators), and Jenkins will simply wait for the CLI command to complete. During the run, logs can stream to the console. After completion, the CLI exits and you can retrieve results.
To make result handling easier, the NeoLoad Jenkins plugin (or a good CLI practice) will output test metrics and even fail the build if certain conditions aren’t met. In the demo, it was shown that NeoLoad can return a pass/fail status based on predefined SLAs – for example, if the average response time exceeds your threshold or if too many errors occurred, the test can be marked as failed. Jenkins can pick up this status (for instance, via a JUnit XML report generated by NeoLoad) and mark the build unstable or failed accordingly. This means your pipeline can automatically stop a release if performance criteria regress, enforcing quality gates. The demo also highlighted how NeoLoad results can be published – e.g., archiving an HTML or PDF report for the build, or using the Jenkins plugin to display trend graphs of response times and error rates on the Jenkins job dashboard.
Crucially, this integration isn’t limited to Jenkins. You can apply the same principles in other CI/CD tools like GitLab CI or Azure DevOps by using their scripting tasks or extensions. NeoLoad’s ability to run in a headless, automated fashion makes it very CI-friendly. As noted, you can trigger NeoLoad tests automatically in these pipelines, passing in dynamic test parameters (like varying load levels per environment) and even analyzing performance metrics as part of the pipeline flow. The end result: performance testing becomes a continuous, automated check in your delivery process, much like unit tests or security scans, allowing teams to catch performance issues early and often.
Managing Test Assets with GitOps (NeoLoad as Code)
One of the challenges in scaling performance testing is managing your test scripts and scenarios as your application changes. NeoLoad addresses this with its “performance testing as-code” capabilities, which were also discussed in the session. Rather than relying solely on binary project files edited in a GUI, NeoLoad allows you to define load test scenarios in a human-readable YAML format. These YAML definitions can describe everything from user paths (sequences of actions to simulate), test scenarios (combination of user paths, load profiles, duration, etc.), and even SLAs for determining success criteria.
The big advantage of having tests in YAML (or any text-based form) is that you can treat them like code. You can store your NeoLoad test configurations in a Git repository alongside your application’s code. This GitOps approach brings version control, collaboration, and traceability to performance testing. As the NeoLoad documentation notes, as-code tests are plain text files that can be managed just like any source code – you can version them in Git, SVN, etc., enabling teams to track changes and work on performance scripts collaboratively. When a developer updates an API endpoint or changes a workflow, the performance test definitions can be updated in the same branch/commit. Code reviews can include reviewing changes to performance tests, ensuring test integrity as the system evolves.
Storing NeoLoad assets in source control also means your CI pipeline can fetch the latest test definitions each time it runs. For instance, your Jenkins pipeline could pull the repository which contains the NeoLoad project or YAML files, then use the NeoLoad CLI to upload those to NeoLoad Web and execute them. This ensures the pipeline is always testing with the latest scenarios that match the application under test. It also facilitates branch-specific testing – e.g., if a feature branch has a new user journey, you could add a new YAML test for it in that branch; the CI can run it on that branch’s deployments, giving performance feedback specific to the new feature.
Another benefit discussed is that NeoLoad’s as-code approach allows parameterization and environment-specific configurations through code. You might maintain different settings for dev vs. staging (such as target URLs, smaller load vs. larger load), and manage these via configuration files in source control. By embracing GitOps for performance tests, teams ensure that their load testing artifacts are versioned, consistent, and easily reproducible – eliminating the “works on my machine” problem and making it easier to integrate into automated pipelines.
Automating Test Analysis and Reporting
Running tests is only half the battle – the real goal is to automate the analysis of results and make the outcome visible to the team. NeoLoad provides several features to integrate result analysis and reporting into CI pipelines, many of which were highlighted during the webinar.
First, SLA-based automation allows the pipeline to automatically evaluate whether a test passed or failed. In NeoLoad, you can define SLAs (service level agreements) for performance metrics – for example, a maximum response time for a transaction, or an error rate threshold. When the test runs, NeoLoad will determine if those SLAs are met. The NeoLoad CLI and Jenkins plugin can then output a JUnit-format report reflecting the SLA status. This means Jenkins (or another CI server) can consume the results as it would a unit test result – marking the build as failed if a critical SLA failed, for instance. The webinar demo showed this in action: after the NeoLoad test stage, the pipeline was able to automatically fail due to an SLA breach (simulating what would happen if the new code introduced a performance regression). This kind of automated gating ensures that no build that degrades performance beyond acceptable limits gets promoted without visibility.
Beyond pass/fail, NeoLoad offers rich reporting that can be integrated into your CI process. The CLI can export an HTML or PDF report at the end of the test, which you can archive as a build artifact for later review. The Jenkins NeoLoad plugin even goes a step further: it can refresh trend graphs on the Jenkins job page, showing how response times or error rates are trending across builds. In the webinar, they emphasized how trends over time are key – by looking at performance metrics across builds, you can spot gradual degradations even if each individual build is within SLA. NeoLoad Web itself retains the history of test results (each test execution is stored with all its metrics), and teams can use NeoLoad Web’s dashboard to do deeper analysis. Because NeoLoad Web is a browser-based platform, anyone on the team (developers, QA, ops) can log in and view detailed results and graphs for any test – making performance results accessible and team-friendly. For example, a developer who sees a build failed due to performance can jump into NeoLoad Web, open the latest test result, and examine which transactions were slow or which errors occurred, without needing to run the test themselves.
To further automate analysis, some teams integrate NeoLoad with monitoring/observability tools (as NeoLoad supports integrations with Dynatrace, Prometheus, etc., though this was more tangentially mentioned). This allows correlation of load test events with infrastructure metrics or APM data. While not covered in depth in this article, it’s worth noting that such integrations can feed into pipeline analysis too – e.g., automatically checking if any application server metrics went out of bounds during the test.
In summary, automating the analysis and reporting means that after the test stage in your pipeline, there is clear feedback on how the system performed. The pipeline can halt on serious regressions, developers get immediate insights to act on, and test reports are available for review. By the time a build passes CI, you have confidence not just in its functional correctness but also in its performance profile.
Best Practices for Scalable Performance Testing in CI Pipelines
Integrating NeoLoad with CI/CD is powerful, but to get the most value, QA teams and engineers should follow some best practices. Here are several recommendations (many discussed in the expert session) for effective and scalable performance testing within pipelines:
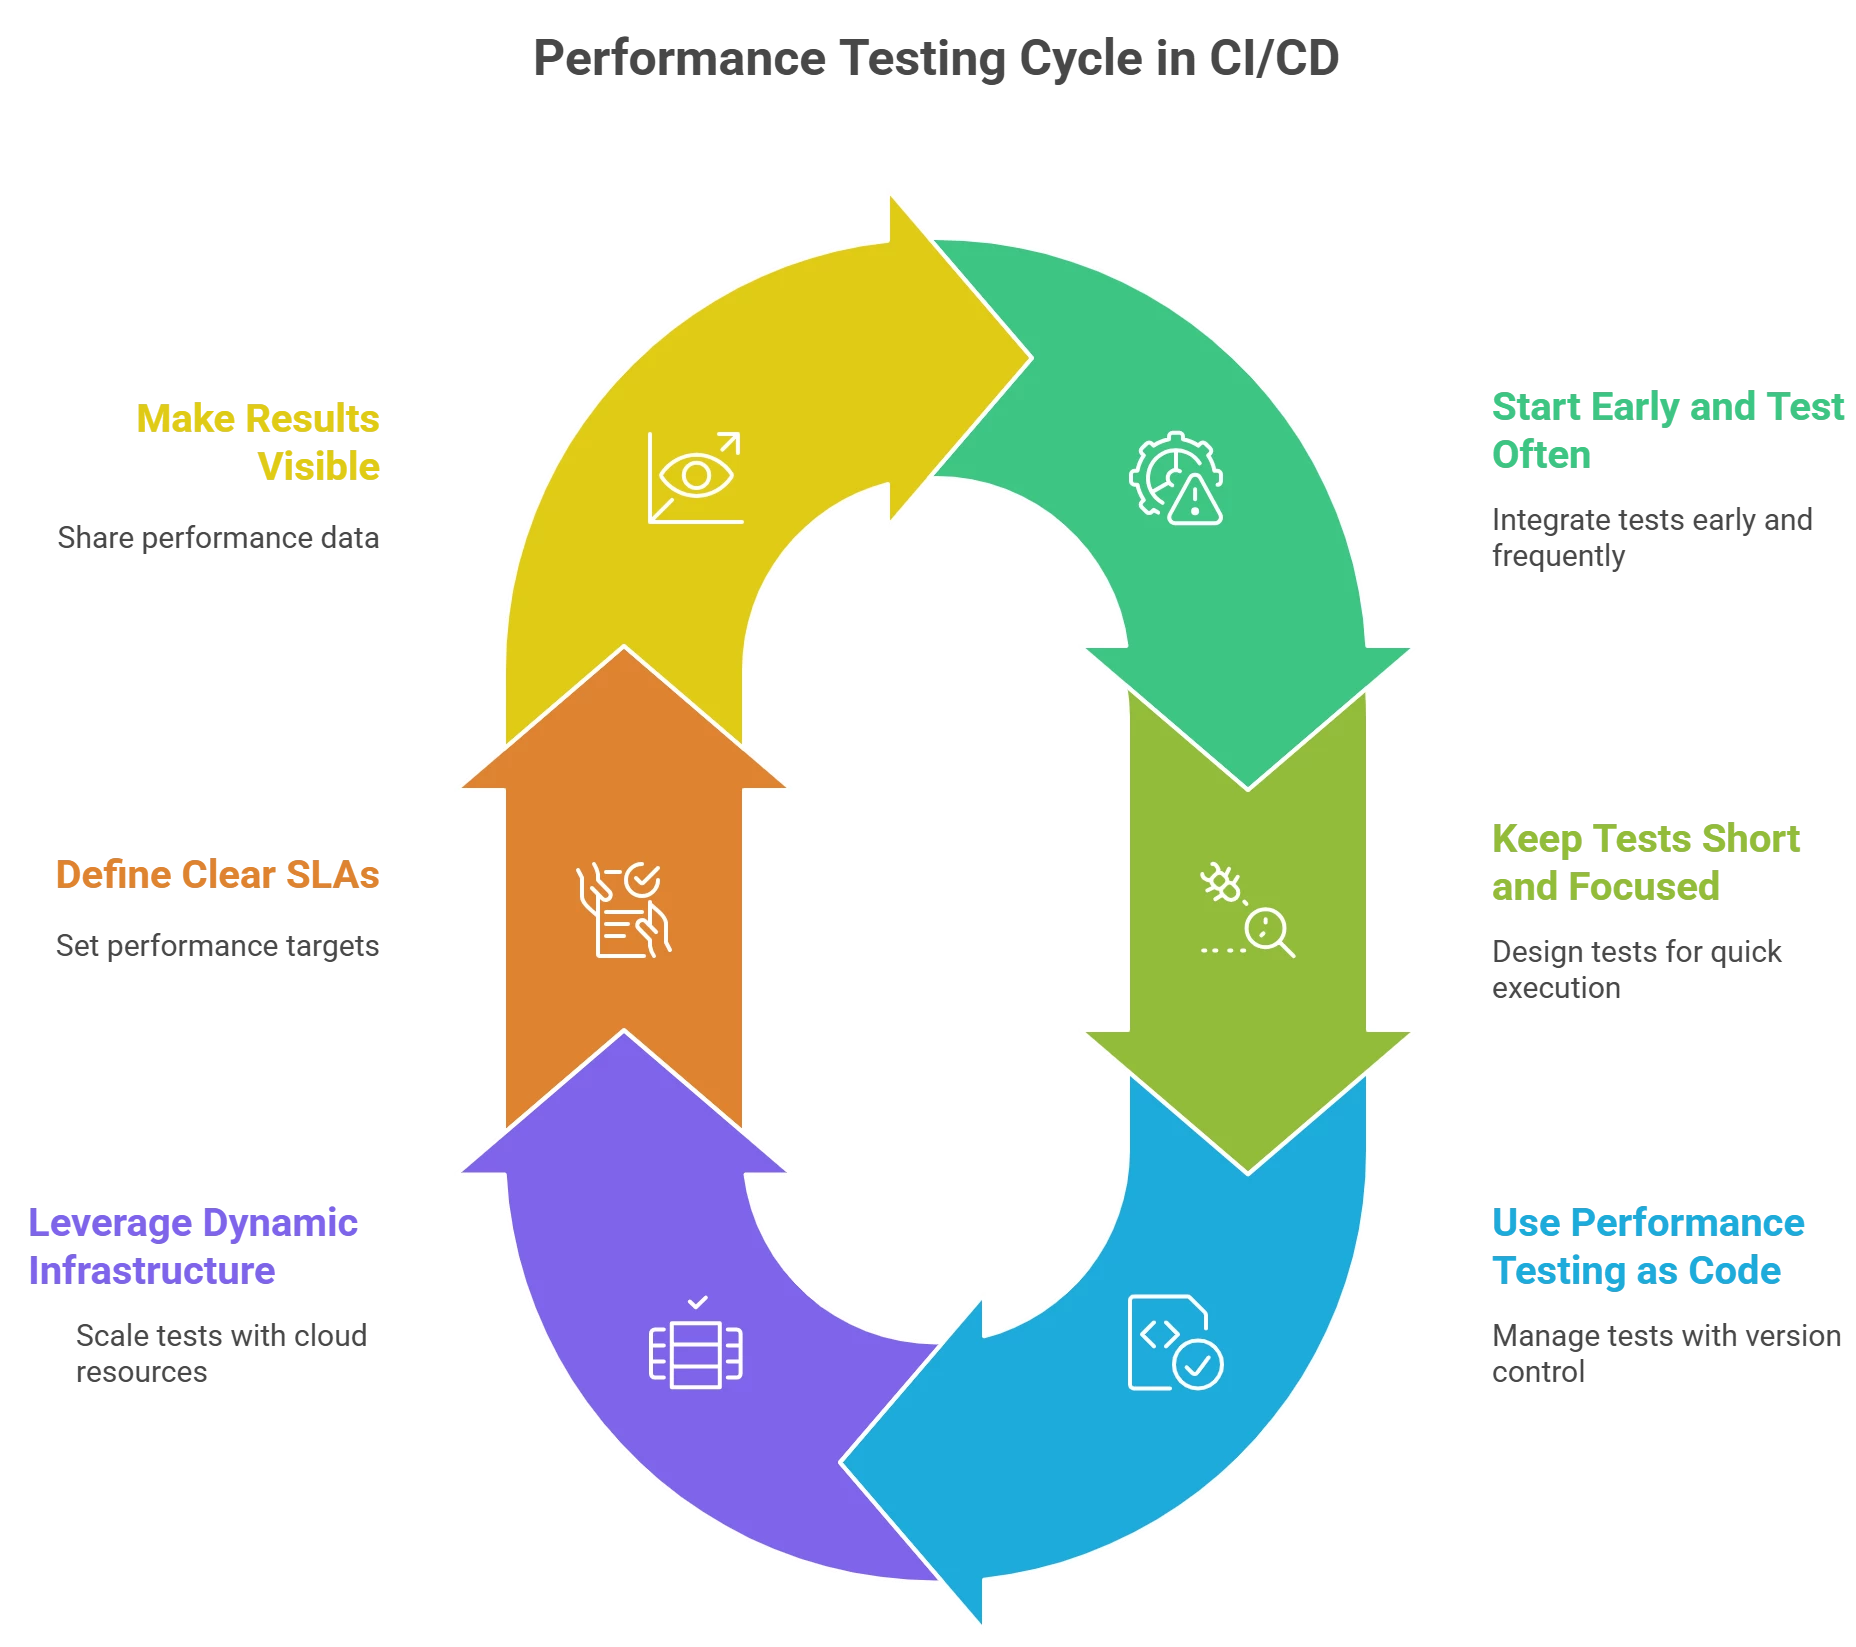
- Start Early and Test Often: Incorporate performance tests as early as possible in the pipeline (unit test and integration test stages) and run them frequently. Even small-scale “smoke” load tests on every build can catch obvious performance issues. Then schedule more comprehensive load tests (e.g., larger user volumes or longer durations) at regular intervals – such as nightly or before major releases. This layered approach ensures quick feedback for each commit and deeper coverage when needed, aligning with the shift-left philosophy.
- Keep CI Tests Short and Focused: Design your pipeline performance tests to run in a reasonable time (e.g., a few minutes) so they don’t bottleneck the CI cycle. Focus on critical user flows or endpoints for quick checks. You can use a smaller number of virtual users or shorter durations in CI just to detect gross regressions. Save the very heavy or long-duration tests for off-peak times or separate jobs. NeoLoad lets you reuse scenarios at different scales easily, so you might have a “smoke test” scenario and a “stress test” scenario derived from the same scripts.
- Use Performance Testing as Code (and Version Control): Manage your NeoLoad test definitions in source control (Git) alongside your application code. This ensures test scripts stay in sync with application changes and fosters collaboration (via code reviews) on performance tests. It also makes your tests portable and reproducible in any environment. When everything is defined as code (in YAML or NeoLoad project files), spinning up a new test or environment is straightforward and automated. As a bonus, storing test artifacts in Git enables easy integration with pipeline triggers – for instance, if a test script changes, the CI can run that test to validate it.
- Leverage Dynamic Infrastructure for Scale: To run large-scale tests on demand in your CI pipeline, take advantage of NeoLoad’s support for cloud and dynamic infrastructure. NeoLoad can automatically provision load generators (on cloud providers or containers) when a test starts, and destroy them after. This means you don’t need a permanent load testing lab idle most of the time – your pipeline can scale up injectors only when needed. Ensure your CI agents have network access and credentials to control these cloud resources (or use NeoLoad SaaS which handles the provisioning). This dynamic approach keeps performance testing scalable and cost-effective, allowing even high-load tests to run as part of CI/CD when appropriate.
- Define Clear SLAs and Automate Pass/Fail Criteria: Establish performance targets (SLAs) for your key transactions and include those in your NeoLoad test scenarios. For example, set a maximum page response time, or a failure rate threshold. Automate the enforcement of these SLAs in the pipeline – using NeoLoad’s ability to output JUnit results or the plugin’s build result integration. This way, if a code change causes the login response time to double and violate the SLA, the pipeline can immediately flag it. Clear performance gates keep everyone accountable and ensure that performance doesn’t silently degrade over time.
- Make Results Visible and Learn from Trends: Treat performance results as a first-class citizen of your pipeline outputs. Publish NeoLoad HTML/PDF reports or use the Jenkins plugin to show trend graphs of recent test runs. Over time, analyze these trends to understand how each new feature or commit impacts performance. If you notice a slow creep in response times across builds, you can proactively address it before it becomes a major issue. Sharing the performance dashboard (NeoLoad Web) with developers and product owners can also increase awareness and fast feedback – anyone should be able to see, “Did our last commit slow things down?” easily. A collaborative, transparent approach to performance data helps build a performance-oriented culture.
By following these best practices, teams can ensure that performance testing in CI pipelines is reliable, efficient, and scalable. The goal is to embed performance testing into the DevOps workflow so that it’s not a one-off activity but rather an ongoing validation, much like unit tests or CI builds themselves. NeoLoad’s toolset – from CLI integration to performance-as-code and automated analysis – is designed to support these practices, enabling QA and engineering teams to deliver fast yet stable applications.
Conclusion and Next Steps
Integrating Tricentis NeoLoad with CI pipelines empowers teams to catch performance problems early and often, ensuring that every code change is vetted for speed and scalability. By using the NeoLoad CLI and treating performance tests as code, QA engineers and developers can seamlessly plug load testing into automated workflows. The end result is a shift-left performance strategy: feedback loops are shortened, performance regressions are identified when they’re easiest to fix, and your software releases become more reliable under real-world loads.
NeoLoad’s robust integration capabilities – from Jenkins pipeline steps to GitOps support and automatic result analysis – make it a natural fit for DevOps and Agile environments where continuous testing is key. As you modernize your QA process, remember that performance is a feature too, and it needs to “shift left” along with functional testing. With the right approach, your CI/CD pipeline can become not just a validation mechanism for code quality, but also a guardian of application performance.
Watch the full webinar to dive deeper and see a live demo
Tricentis Expert Session: Using NeoLoad with CI Pipelines. available on-demand through Tricentis Academy. Check it out for a comprehensive walkthrough and additional expert tips.