


In today’s DevOps-driven world, QA teams are expected not only to test for functionality but also for performance under real-world conditions. How can we ensure our performance tests reflect what happens in production? One powerful approach is to integrate Application Performance Monitoring (APM) tools like DataDog directly into performance testing workflows. This article explores why this integration is so important and how it works in practice – in particular, how Tricentis NeoLoad (a performance testing tool) works hand-in-hand with DataDog’s APM. We’ll break down the technical details (tagging virtual users, data flows, API keys) in an accessible way and highlight the big benefits for QA testers and developers. Let’s dive in!
Why Combine APM with Performance Testing?
Performance testing and APM are a natural fit. APM tools such as DataDog are traditionally used by IT Operations to monitor apps in production – tracking metrics like CPU usage, memory, database response times, etc., to catch issues before users notice. Meanwhile, performance testing (using tools like NeoLoad) simulates heavy loads on an application in a pre-production environment to see how it behaves. By integrating the two, teams achieve end-to-end visibility: from the virtual user’s actions in the test all the way to the backend servers’ performance, just like in a real production scenario.
Without integration, testers might have to manually compare separate reports – one from the load test and another from monitoring tools – which is cumbersome and can delay finding the root cause of issues. Bringing APM data into the testing phase eliminates this gap. In fact, industry trends show that as more organizations adopt DevOps practices, they demand APM solutions that “integrate seamlessly into the CI/CD pipeline” to catch performance bottlenecks early. Businesses across all sectors – from finance to retail – are increasingly investing in APM tools to ensure reliability and optimal performance of their digital services. It’s clear that linking APM with testing is becoming a best practice for modern teams.
From a QA perspective, having production-like monitoring during tests means you can correlate every test scenario with system behavior. For example, if a login transaction is slow, you can immediately see if it’s due to high CPU on the server, database query time, or something else – because DataDog is recording those metrics in real time. No more guesswork or “it works on my machine” confusion. Performance issues that might slip by in a pure load test (for instance, a test that “passes” response time criteria but causes a memory spike) can be caught because the APM data exposes the underlying symptoms.
Moreover, APM integration fosters a culture of collaboration. QA engineers and IT Ops (and even developers) can each view the same performance test results through the lens of their preferred tools. NeoLoad can pull in backend metrics and overlay them on test results, and at the same time it pushes test metrics into DataDog. This means Ops folks, who live in DataDog, can examine how the system behaved during a test, while QA folks, who live in NeoLoad, can see how the system under test was performing without switching tools. Each team works in the environment they know best, yet they’re looking at a shared truth. This cross-tool visibility “breaks down communication barriers” and aligns teams toward the common goal of building high-performing applications.
Finally, integrating APM into testing helps catch issues early and prevent nasty surprises in production. APM data during tests can reveal trends that pure test scripts might not flag. Imagine an ops engineer saying: “The test passed, but why did this new build suddenly start consuming 40% more CPU?”. That’s the kind of insight you get when Ops is involved in analyzing test runs. They can raise a flag on a potential problem that QA or developers might not have noticed, since those metrics aren’t typically in a test report. This collaborative analysis leads to stronger releases. In fact, organizations that integrate NeoLoad with DataDog have reported up to 80% reductions in time spent analyzing performance results, and 70–90% fewer performance-related incidents in production (with faster remediation when issues do occur). Those are hugely encouraging numbers for any team looking to improve quality and reliability.
How the NeoLoad–DataDog Integration Works
So, how do NeoLoad and DataDog actually talk to each other? It turns out the integration is both straightforward to set up and deep in capabilities.
At a high level, here’s what happens when you integrate DataDog APM into a NeoLoad performance test:
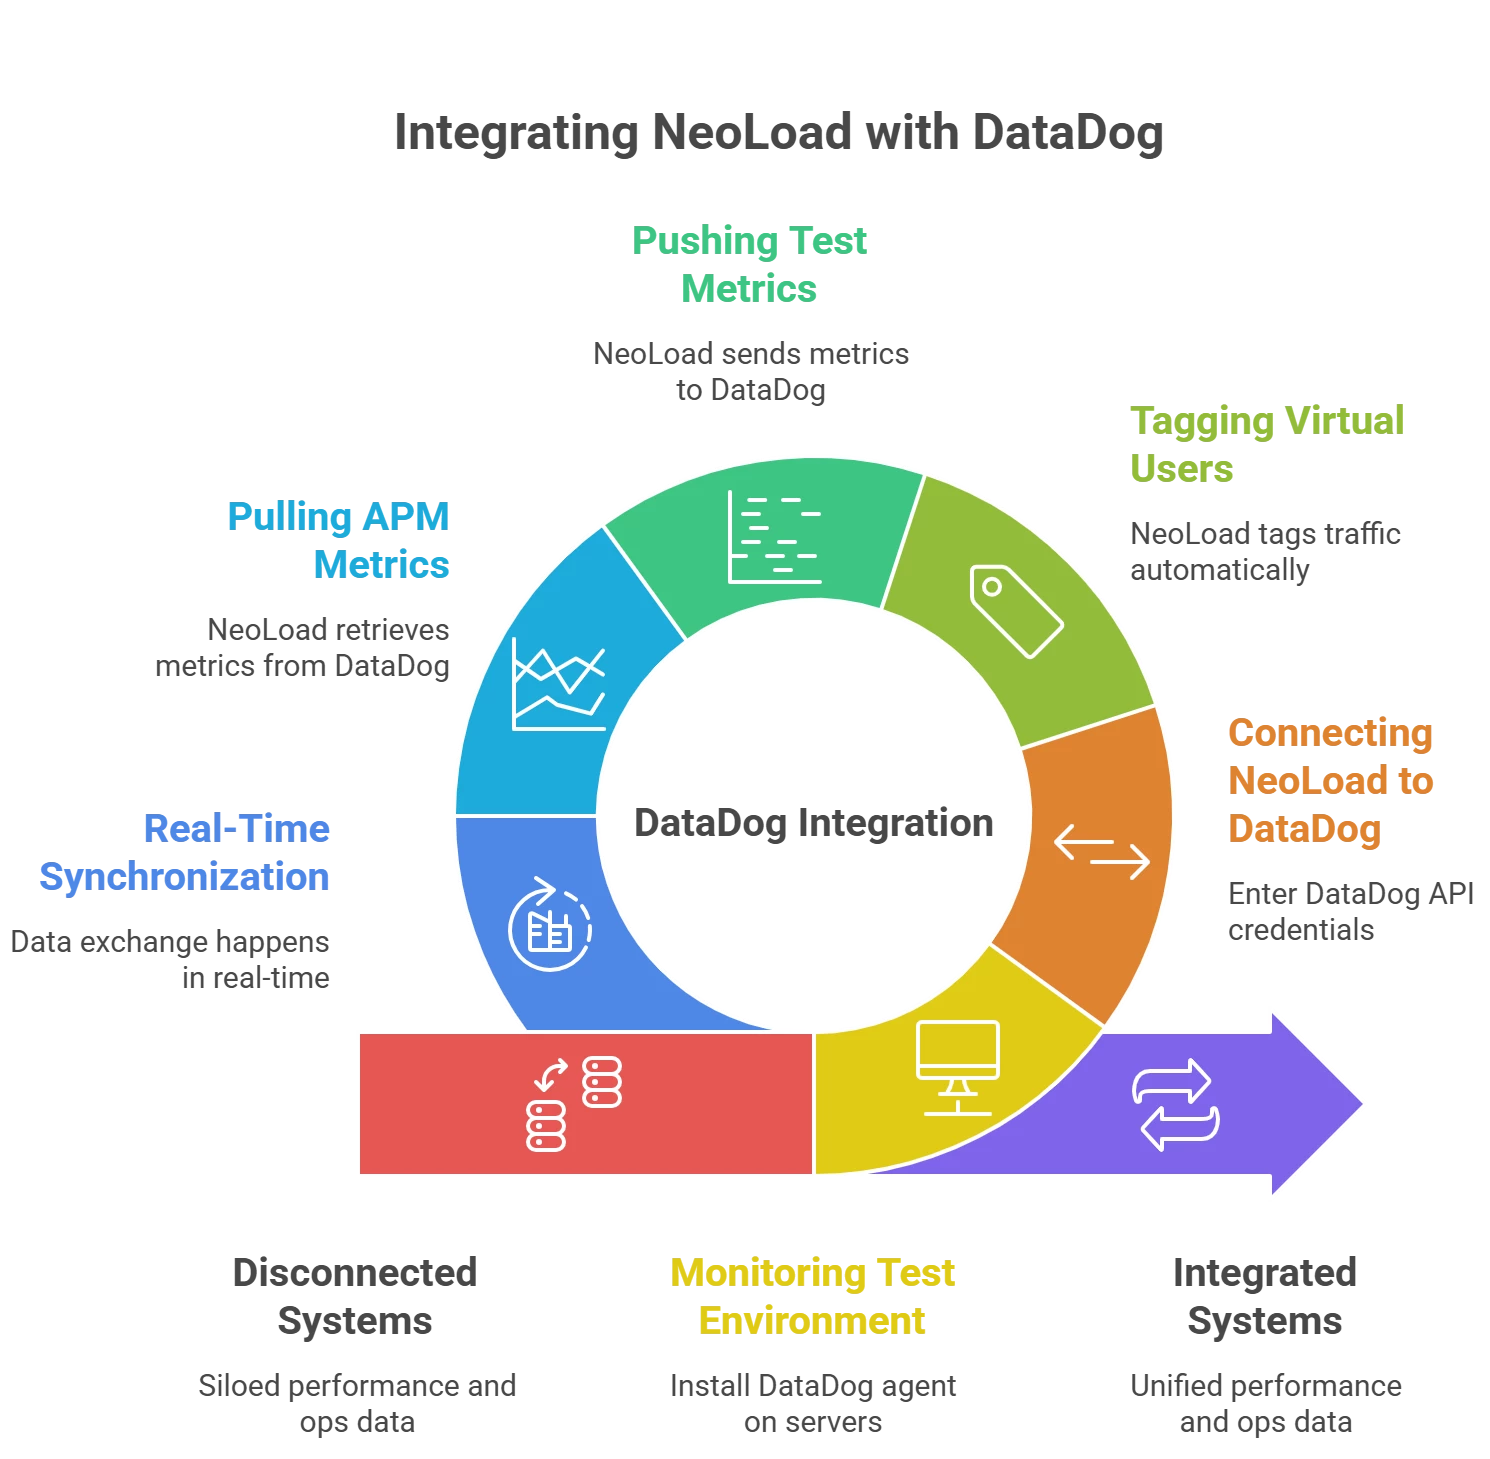
- Monitoring the Test Environment: First, ensure that the system under test (the application and servers you’re load-testing) is being monitored by DataDog. This usually means installing the DataDog agent on those servers or containers. If DataDog isn’t watching the environment, the integration won’t have any ops data to work with. Once DataDog is in place, it will collect metrics from your app, OS, database, etc., during the test – just as it would in production.
- Connecting NeoLoad to DataDog: In NeoLoad, you enter your DataDog credentials to establish a connection. Specifically, you’ll generate an API key (and likely an Application Key) in DataDog’s interface and plug those into NeoLoad’s DataDog integration settings. These keys let NeoLoad securely send data to DataDog and fetch data from it. The configuration in NeoLoad is very straightforward – essentially just copying those keys into NeoLoad’s preferences – and that’s it! No complex scripting or plugins on your part.
- Tagging Virtual Users with APM Labels: Here’s where the magic happens during a test run. When you start a NeoLoad test with the DataDog integration enabled, NeoLoad automatically tags each virtual user’s traffic with a special header that DataDog can recognize. You don’t need to change your test scripts at all – NeoLoad injects this header into every request behind the scenes. This header carries information like “this request is from NeoLoad test X, virtual user Y, transaction name Z,” etc. As a result, DataDog’s APM traces know that these incoming transactions are part of your test. (DataDog even has an official NeoLoad plugin that, once installed, understands these tags and provides some default dashboards.)
- Pushing Test Metrics to DataDog: While the test is running, NeoLoad doesn’t just sit back – it also acts as a data source for DataDog. NeoLoad sends its own metrics to DataDog’s API in real time, as if it were another monitoring agent. This includes metrics like the number of virtual users active, throughput (bytes/sec), HTTP request rates, transaction response times, error counts, etc. For example, DataDog will record how many virtual users are running over time under a metric name like NeoLoad.Controller.User.Load, among others. NeoLoad also pushes important events – for instance, it can send a “Test Started” and “Test Finished” event to DataDog when a test run begins and ends. These NeoLoad-provided data points get stored in DataDog just like any other metric, so you can visualize them or set alerts on them in DataDog.
- Pulling APM Metrics into NeoLoad: The integration is bi-directional. As NeoLoad is pumping data into DataDog, it’s also pulling data out. NeoLoad can be configured to retrieve any metrics you choose from DataDog and display them on NeoLoad’s side. How does NeoLoad know what to pull? This can be as simple as selecting from pre-built DataDog dashboards or entering DataDog query strings for metrics. In fact, NeoLoad leverages DataDog’s existing dashboard queries – “we just want to inherit that work” that Ops teams have already done in figuring out what to monitor. For example, if your Ops team has a CPU utilization graph in DataDog for the database server, NeoLoad can use that same query to grab the CPU metric during the test. This means QA engineers automatically get the benefit of all the monitoring expertise Ops has developed. NeoLoad simply asks DataDog for those measurements during the test run via the API, and then overlays them onto the load testing timeline (e.g., seeing response times alongside CPU%, memory, etc. in the NeoLoad results dashboard).
- Real-Time Synchronization: All of this data exchange happens in near real-time. As your test runs, you can watch a DataDog dashboard and see NeoLoad metrics (like active users or error rates) updating live next to system metrics. Simultaneously, in NeoLoad’s interface, you see graphs of your test with lines for CPU, memory, and other DataDog-collected stats updating as the test progresses. It’s a two-way street: NeoLoad pulls in application performance data, and pushes out test performance data, giving both tools the full picture. This deep integration is possible because NeoLoad and DataDog speak through those API keys and share a common tagging of events. The result is that whether you’re a developer/QA looking at NeoLoad, or an Ops engineer looking at DataDog, you’re essentially looking at the same story just presented in two different ways.
To make this concrete, let’s consider an example: Say you have a test scenario ramping up 100 virtual users hitting a web service. With the integration enabled, NeoLoad will label each request so that in DataDog’s APM you could filter or search traces by “NeoLoad test run = XYZ”. DataDog will capture everything it normally does (CPU, DB queries, etc.), and also log an event like “NeoLoad Test XYZ started at 12:00:00”. NeoLoad will concurrently send DataDog metrics like “virtual_users = 100” and “requests_per_sec = 50” at that moment. If an error spike occurs, NeoLoad logs it to DataDog. Meanwhile, NeoLoad is also pulling from DataDog – maybe the average CPU of your web servers – and plotting it live. By the end of the test, both tools have a complete record of what happened: DataDog has all the infrastructure metrics plus the test’s load metrics, and NeoLoad has all the test results plus the infrastructure metrics.
Setting up this integration is remarkably simple given the power it provides. In summary: you deploy DataDog monitoring on your test environment, add your DataDog API/app keys into NeoLoad, and NeoLoad takes care of the rest – from tagging users to syncing data. DataDog provides a NeoLoad plugin/integration that you can install from the DataDog marketplace, which automatically recognizes those NeoLoad tags and even creates a default “NeoLoad Performance Testing” dashboard for you. That means right after you set it up, you can run a test and immediately see a rich dashboard on DataDog (like the one above) without building any custom charts. On the NeoLoad side, you don’t need to script any monitoring – just select which DataDog metrics you want to see. It’s a plug-and-play integration that “just works” out of the box.
Benefits for QA Teams and DevOps Collaboration
Integrating an APM tool like DataDog into NeoLoad isn’t just a cool technical trick – it has tangible benefits for the team and the quality of software releases.
Let’s highlight some key advantages this brings to QA engineers, developers, and IT Ops:
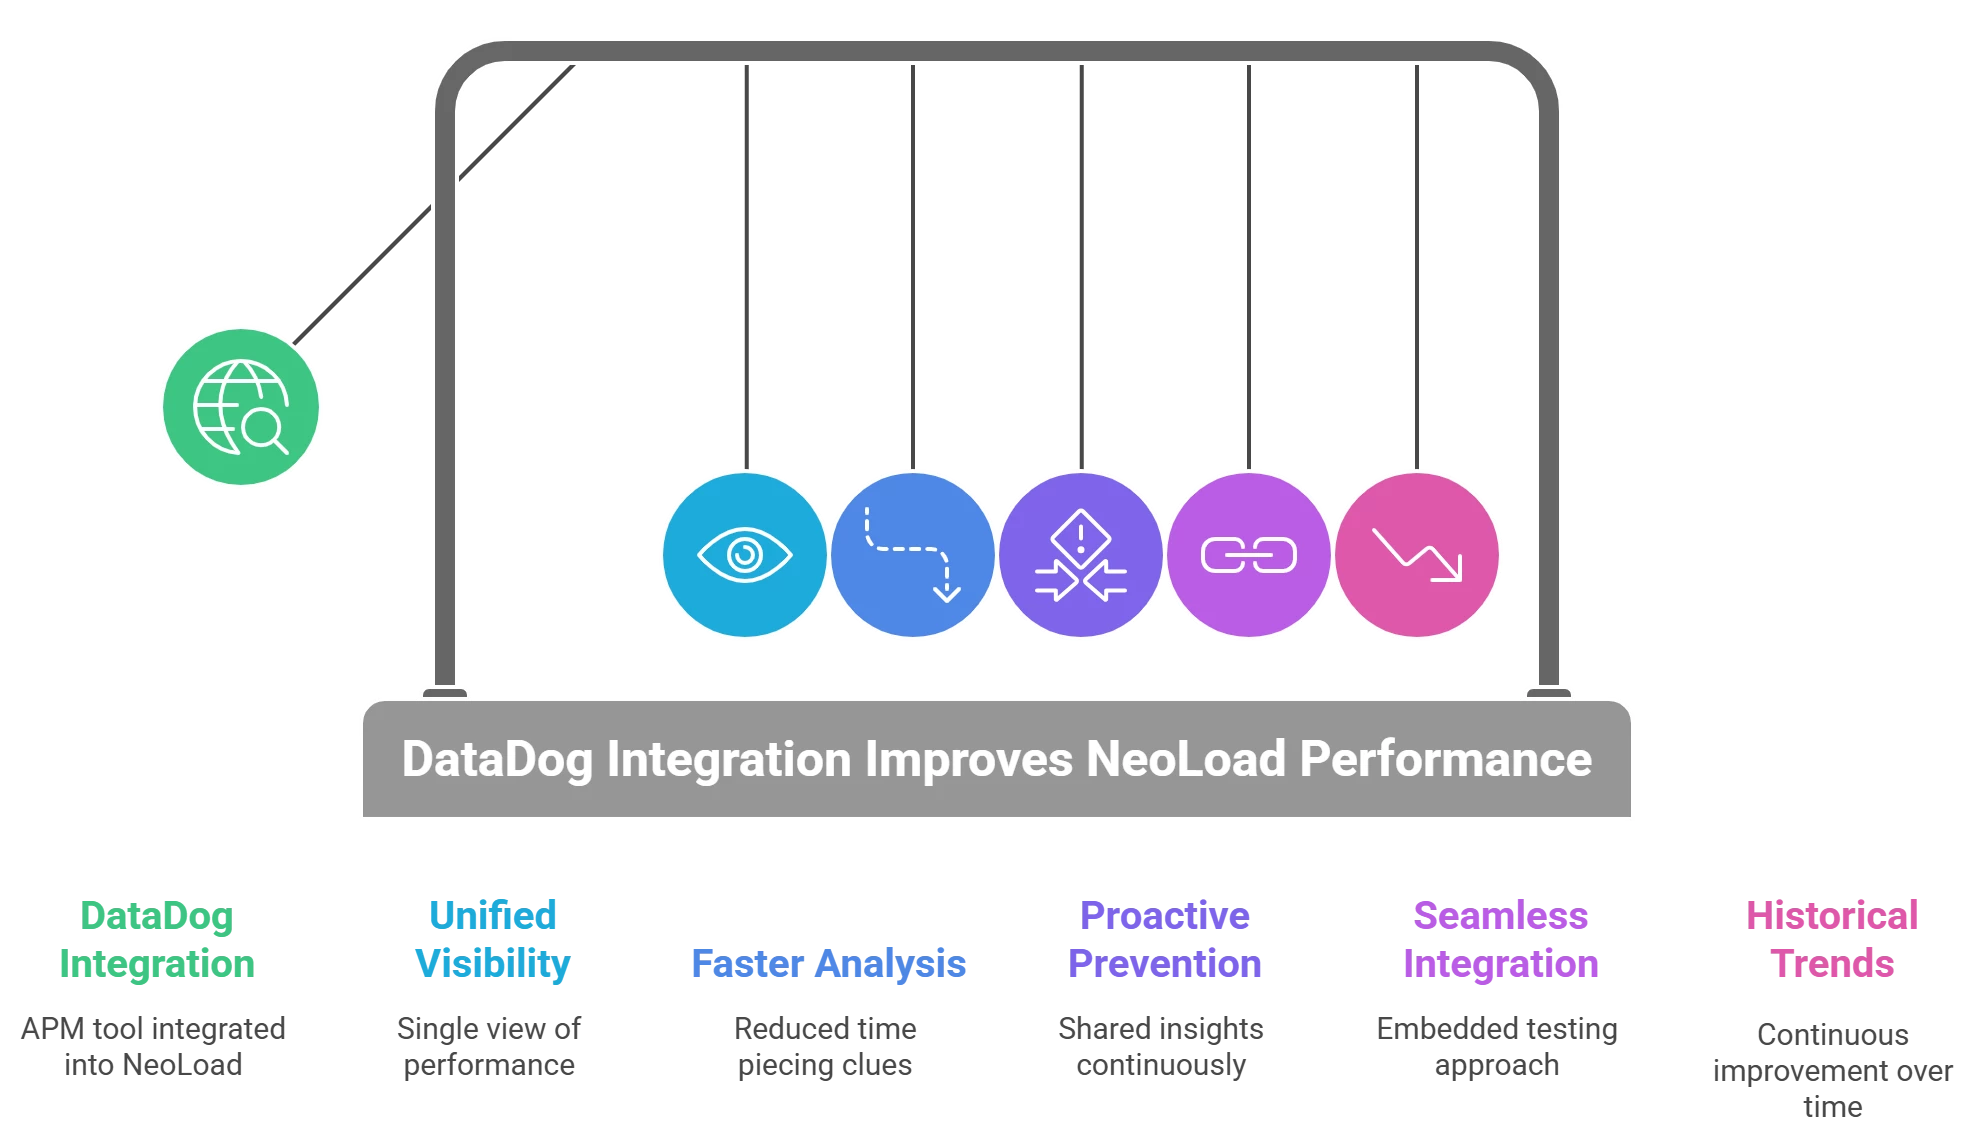
- Unified, End-to-End Visibility: Teams get a single, unified view of performance from both the user perspective and the system perspective. NeoLoad and DataDog together allow you to correlate user experience metrics (e.g. response times, error rates) with deep system metrics (CPU, memory, database calls) instantly. This end-to-end visibility means faster root cause analysis. You’re no longer guessing if a slowdown was due to the code or the environment – the data is all there in front of you.
- Each Team Uses Their Preferred Tool (No Learning Curve): Because results are visible in both NeoLoad and DataDog, different roles can work where they’re comfortable without missing any information. Performance testers can stay in NeoLoad and see all the server stats overlaid on their test results, while Ops engineers can stay in DataDog and see all the test events/metrics in their dashboards. There’s no need to grant special access or train team members on a new tool just to view results – “every consumer of performance data can do so in their preferred solution”. This lowers resistance to collaboration, since everyone sticks with the interface they know best.
- Faster Analysis and Issue Detection: When performance test data and monitoring data are combined, teams spend far less time piecing together clues. According to Tricentis, teams using NeoLoad+DataDog have cut down analysis time by as much as 80%. It’s easy to see why – instead of exporting logs and trying to overlay timestamps manually, the integration does it for you in real time. This means bottlenecks or anomalies during a test are spotted quickly. If a new code change causes higher memory usage, you’ll see that trend during the test and can investigate immediately rather than finding out later in production.
- Proactive Problem Prevention (Shift-Right for Ops, Shift-Left for Dev): The collaboration enabled by APM integration lets Ops and Dev/Test share insights continuously. Ops teams gain visibility into how new builds are being tested under load, and can validate if their monitoring alerts would catch issues, or even adjust their monitoring based on test findings. For example, if a test revealed a certain microservice is a hotspot, Ops can ensure they have dashboards and alerts ready for it in production. Conversely, developers get Ops’s perspective earlier – they can design with those performance constraints in mind. This closes the feedback loop. A great example of this is the earlier scenario: an Ops engineer notices a 40% CPU jump during a test and flags it. The team can address that before the software ever goes live. In general, by bringing production-like monitoring into QA, the whole team moves toward a DevOps model where performance is a shared responsibility, not an afterthought.
- Seamless Integration into CI/CD Pipelines: Because NeoLoad can be automated (e.g. via its CLI or as code) and DataDog has APIs and CI plugins, you can embed this integrated testing approach into your continuous delivery pipeline. Imagine: a developer checks in code, your CI server spins up a test environment with DataDog agents, runs a NeoLoad test, and automatically passes the data to DataDog. The results – both test metrics and system metrics – could then be published or even used as gates in the pipeline. DataDog integration makes such automation straightforward. It aligns with industry observations that the rise of DevOps is driving demand for APM tools to plug into CI so developers can catch issues early. The payoff is a more holistic CI/CD: not only functional tests, but performance tests with monitoring, running on every build. This fosters tighter cooperation between dev, QA, and ops during the fast-paced release cycle. In practice, teams using this approach have seen significantly fewer performance-related incidents post-release – many potential problems are weeded out in the pipeline.
- Historical Trends and Continuous Improvement: Storing test results in DataDog isn’t just useful in the moment – it also allows historical trending of performance. DataDog can retain metrics over time, so you can compare the current release’s performance test to last month’s or last year’s. You can spot trends, such as gradually increasing memory usage across releases, and address them proactively. NeoLoad’s integration makes it easy to push results to DataDog so they can be charted over long periods. This kind of trending is hard to do with standalone test reports. Additionally, DataDog’s alerting capabilities mean you could set up alerts if a test’s metrics exceed certain thresholds (for example, if response time under load is 20% worse than the previous build, trigger an alert). Some teams even configure automated remediation or scaling actions based on test outcomes: DataDog can kick off scripts if certain conditions are met during a test. All of this helps organizations build a performance-aware culture, where performance testing isn’t a one-off activity but a continuously monitored aspect of quality.
Ultimately, the biggest benefit is improved confidence and collaboration. When QA and Ops look at the same data, trust between teams increases. There’s less finger-pointing (“it must be an environment issue” vs. “no, your test is flawed”) because everyone can see what actually happened during the test, in full detail. As one expert put it, the integration allows performance engineering teams and IT ops teams – both of whom want fast, reliable applications – to work together toward that goal, each contributing their expertise. The result is not only faster troubleshooting, but better software delivered to users. By the time you go to production, you’ve already observed your app under stress with production-grade monitoring. It’s hard to overstate the value of that peace of mind for a QA team.
Conclusion
Integrating Tricentis NeoLoad with an APM platform like DataDog can be a game-changer for QA testers and developers focused on quality. It brings testing and monitoring into harmony – providing rich, real-time insights during performance tests, and fostering a much tighter collaboration with Ops. Teams that have adopted this approach are seeing quicker analysis, fewer performance surprises in production, and a more streamlined DevOps workflow for performance engineering. In a landscape where application complexity is growing and user expectations are higher than ever, this kind of integration helps ensure you’re delivering fast, resilient applications with confidence.
If you found these concepts intriguing and want to see them in action (and learn even more), a great next step is to watch the on-demand webinar:
In that session, Tricentis experts demonstrate the NeoLoad–DataDog integration live and discuss best practices. Check it out!