


Performance testing is a critical part of delivering quality software, regardless of whether your team follows traditional waterfall release cycles or agile sprints. In both methodologies, neglecting performance can lead to unpleasant surprises in production. This guide explores how to plan effective performance test scenarios using Tricentis NeoLoad, covering why performance testing matters, the types of performance tests, the concept of think time, and how NeoLoad’s scenario design features (user paths, populations, and scenarios) can be leveraged. We’ll also discuss best practices demonstrated in a recent Tricentis expert session webinar, continuous performance testing strategies, and aligning tests with business goals for maximum impact.
Why Performance Testing Matters in Both Agile and Waterfall
No matter your development methodology, performance testing should never be an afterthought. In a classic waterfall model, testing often gets squeezed at the end of a long development cycle – if development overruns, the QA phase (including load testing) is rushed. This time crunch limits how deeply engineers can analyze performance issues before release. Agile methodologies are not immune either: teams may pack each sprint with features and fixes, leaving little room for thorough performance evaluation, effectively squeezing out performance testing just as in waterfall.
To avoid these pitfalls, industry experts advocate implementing continuous performance testing as part of the development process. This means running smaller-scale performance tests regularly (e.g. every build or sprint) rather than one big test at the end. By shifting left – testing earlier and more often – teams can catch performance regressions when they are easier (and cheaper) to fix. Over time, continuous testing yields immense value by ensuring each incremental change meets performance standards. It’s hard to put a dollar value on the outages and slowdowns you prevent by this approach, but giants like Amazon and Google have famously shared data underscoring the business impact of performance. For example, Amazon found that every 100 ms of added page load time cost them around 1% in sales – a sobering statistic that highlights why performance is a top concern for any user-facing application.
In short, regardless of your process (agile or waterfall), you should be performance testing continuously. It ensures new releases do no harm to response times or scalability, and ideally that each release is a step forward in speed and stability. Next, we’ll clarify the various types of performance tests you might plan as part of your performance engineering strategy.
Types of Performance Tests:
The world of performance testing comes with a lot of terminology. Different organizations (and even team members) may use these terms in overlapping ways. What one person calls a “performance test” might be someone else’s “load test” or “stress test.” Below, we define the common test types in the context of scenario planning (note: your team should agree on consistent definitions that make sense for you):
- Load Test: A test that simulates expected real-world usage of your application. The goal is to replicate the typical concurrent user load and usage patterns seen in production today. A load test answers, “Can the system handle our current normal load without performance degradation?” It uses realistic user behaviors (logins, transactions, etc.) at volumes the system regularly sees.
- Performance Test: Often used interchangeably with load test, a performance test here means testing with increased load to ensure future growth is supported. For example, if your business projects 2x traffic next year, a performance test might apply ~2x the current load (with a safety margin) to verify the system’s responsiveness and stability at that level. This helps validate that upcoming user growth or business expansion won’t overwhelm the system.
- Stress Test: A test that pushes the system beyond normal load to find its breaking points. The idea is to stress the system with extreme load or usage patterns well outside the expected range. For instance, you keep increasing virtual users or transaction rates until the system either starts failing or performance becomes unacceptable. Stress tests reveal how the application fails (gracefully or catastrophically) and what bottlenecks or limits exist. A classic example of the need for stress testing was when an e-filing website expected a 3.8× traffic spike but got 11.8× – beyond what a standard performance test would cover.
- Spike Test: A specific form of stress test where a sudden, massive load is applied to the system, rather than a gradual ramp-up. This models an abrupt traffic surge – imagine 10,000 users logging in within the same second rather than over minutes. The goal is to see how the system handles a sharp spike: does it crash immediately, slow to a crawl, or gracefully scale? For example, a spike test might simulate everyone hitting your e-commerce site at the start of a big sale. It “smashes” a particular component (like the login service) with a burst of requests to see what breaks.
- Scalability Test: A test focused on the infrastructure’s capacity. Sometimes called a sizing test, it helps determine how adding more hardware or resources affects performance. For instance, you might gradually increase load while also observing how CPU/memory/utilization scale, to validate that your architecture can scale up or out to meet higher loads. Enterprises often use scalability tests when deploying on new infrastructure or planning capacity for a major rollout (e.g., ensuring the chosen cloud VM size or server cluster can handle the expected load).
- Endurance Test (Soak Test): A long-duration test (often 8+ hours, sometimes days) that checks for issues over time. The system might handle 1 hour of load, but will it still behave after 12 hours? Endurance tests reveal problems like memory leaks, resource depletion, or gradual performance degradation that shorter tests miss. They ensure the system remains stable and fast under sustained usage, which is crucial for 24/7 applications. Ops teams value these tests because they mimic continuous usage and can uncover “long-tail” issues.
- Negative Test (Break Test): A deliberately extreme test aimed at breaking the system to see how it fails and recovers. In a negative test, you keep ramping up load or causing stressful conditions until the application collapses – whether that means it becomes unbearably slow or actually crashes. The value here is in observing failure patterns and system behavior right before failure. This can inform capacity planning and help implement safeguards. For example, if you know the system starts throwing errors at 1,000 users, you can set up monitors/alerts as load approaches that threshold. Negative testing teaches you what “signs of impending failure” to watch for in production.
- AOA Test: AOA stands for “All-Out Attack” (or sometimes “All One Activity”), referring to a test that pounds one particular feature or transaction in the system while still having general activity going on. In an AOA test, you shine a spotlight on a single component under load. For example, maybe most users are doing normal browsing, but suddenly everyone generates a complex report at once. This isolates the performance of that report generation component under extreme load. AOA tests are less common, but they’re useful to ensure that a critical part of the system (like a specific service, query, or feature) can handle a concentrated surge.
Each of these test types is essentially a variation of load testing with different objectives or slight tweaks in how load is applied. In practice, the differences often come down to small scenario configuration changes, such as how fast you ramp up, how long you run, or how much “think time” you include between actions. To plan effectively, it’s important to define these test types with your team so that everyone has a common understanding. Next, we’ll discuss one of those subtle but crucial factors – think time – and why it has a huge impact on your test results.
The Role of Think Time in Performance Testing
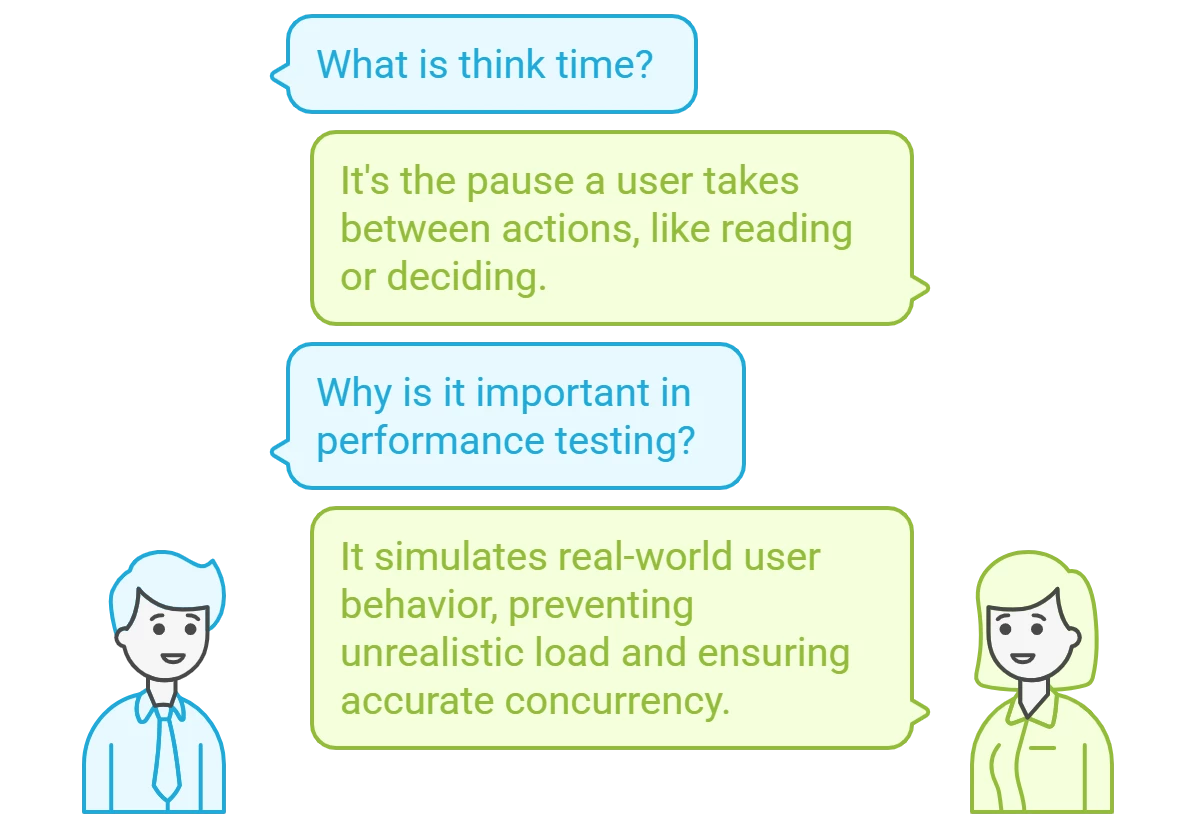
Think time represents the pause a real user naturally takes between actions when using an application. In other words, it’s the time a user spends thinking, reading, or simply hesitating before clicking the next button. Humans don’t hammer applications nonstop; we pause to read content, fill forms, or decide our next step. For example, after a page loads, a user might take 5-10 seconds to digest it before moving on. This delay is modeled as think time in performance tests.
Including realistic think times in your test scripts is vital for simulating real-world conditions. If your script has zero think time, the virtual user will fire requests back-to-back as fast as the system allows – essentially behaving like a robot with superhuman speed. This can inflate the load far beyond actual user behavior. By contrast, adding appropriate think times spaces out the requests, achieving the intended concurrency without unrealistically high throughput.
Why does this matter?
Because think time can massively alter test outcomes. In the webinar demo, the presenter showed that simply reducing the think time per step from ~750ms to ~5ms (essentially removing user delays) made the test behave like a much more intense workload. With normal think times, one virtual user might execute ~2 transactions per minute, but without think time that same user could execute ~200 per minute! That’s a 100× increase in request rate just from a scripting change, not from adding more users. Naturally, metrics like hits per second or transactions per second will skyrocket if think time is removed. This illustrates why you cannot directly compare results from tests with different think time settings – they are fundamentally different scenarios.
Tip: Always review and adjust think times after recording a user path. Remove any absurdly long pauses that got recorded (e.g. if you went to get coffee and left the recorder on, it might have captured a 5-minute “think time” that’s not typical). Conversely, don’t set all think times to zero unless you intentionally want a worst-case stress scenario. Use think time settings consistently to match the type of test: e.g. include full realistic think times for load tests, shorter think times for stress tests, etc..
By default, NeoLoad treats recorded think times as separate from transaction response times, meaning the reported response metrics exclude the user wait time. This is usually what you want – you care about server/app response, not how long the user paused. NeoLoad even provides a “Consider as think time” checkbox to control this: when checked (default), the pause is not counted in transaction timing. If you uncheck it, the delay will be counted as if it were part of the server response, which will artificially inflate reported response times. The default is on for good reason – it yields more realistic performance metrics.
In summary, think time is the secret sauce that makes a virtual user behave like a real user. Properly incorporating it leads to realistic concurrency and reliable results; ignoring it can turn your load test into an unrealistic flood of traffic. Now, armed with an understanding of test types and think time, let’s see how Tricentis NeoLoad helps configure these scenarios.
Designing Performance Scenarios in Tricentis NeoLoad:
Tricentis NeoLoad provides a flexible model for setting up performance test scenarios. Understanding its key components – User Paths, Populations, and Scenarios – will help you organize tests for different purposes without confusion.
- User Path: A user path in NeoLoad is essentially a recorded script modeling a particular user journey or business transaction flow. It’s the series of requests and actions one user would take (e.g. login → search → add to cart → logout). You can record user paths by using NeoLoad’s recorder on your application and then augment them with variables, assertions, think times, etc., as needed. Each user path represents one type of user behavior.
- Population: A population is an intermediate grouping in NeoLoad that sits between user paths and scenarios. You can think of a population as a category of virtual users that all share the same configuration. In the simplest case, a population can correspond 1:1 with a single user path (e.g. “BasicUserFlow” population uses the BasicUserFlow script). This is how other load testing tools typically work – you directly assign scripts to scenarios. NeoLoad’s extra population layer, however, lets you mix multiple user paths together or apply overrides uniformly. For example, you could create a population called “NormalTrafficMix” that is composed of 70% BasicUserFlow and 30% AdminUserFlow. NeoLoad will then handle launching the right proportions of each script. Populations also allow setting global parameters like think time policy or network emulation that apply to all users in that group.
- Scenario: A scenario in NeoLoad ties everything together – it’s the actual test configuration you will run. In a scenario, you specify which populations to include, how many virtual users from each, the load pattern (ramp-up, steady state, ramp-down), test duration, etc.. Scenarios represent complete performance test plans, such as “Checkout_LoadTest_50Users” or “Login_StressTest_NoThinkTime.” NeoLoad allows unlimited scenarios per project, encouraging you to create separate scenarios for different test objectives.
The expert showed how to set up multiple scenarios in one NeoLoad project to cover the various test types we defined. For instance, they had separate scenarios named “Load Test,” “Performance Test,” “Stress Test,” and “Spike Test” – each with appropriate settings for that type. Under the hood, those scenarios used different populations and/or user paths. The Load Test scenario might use a population that includes the full recorded think times (simulating real pacing, e.g. 7-8 seconds pauses).
The Stress Test scenario used a population where the think time was drastically reduced (e.g. an override to 5 ms). They achieved this by either overriding the think time setting in the user path or by creating an alternate version of the script for stress. In the demo, one approach was duplicating the user path and applying a 5ms think time to every step for the stress test version, then assigning that to a separate “StressTest” population. Meanwhile, the Performance Test scenario used the normal script but with a moderate think time (e.g. 750 ms per step), and Spike Test scenario might use no think time for the login transaction but only short bursts of users.
The key takeaway is that NeoLoad makes it easy to configure these variations without messing up your core scripts. Populations act as a convenient layer to adjust think times or mix user types without altering the original recorded user paths. And scenarios let you save those combinations under meaningful names.
Best Practices for Scenario Planning
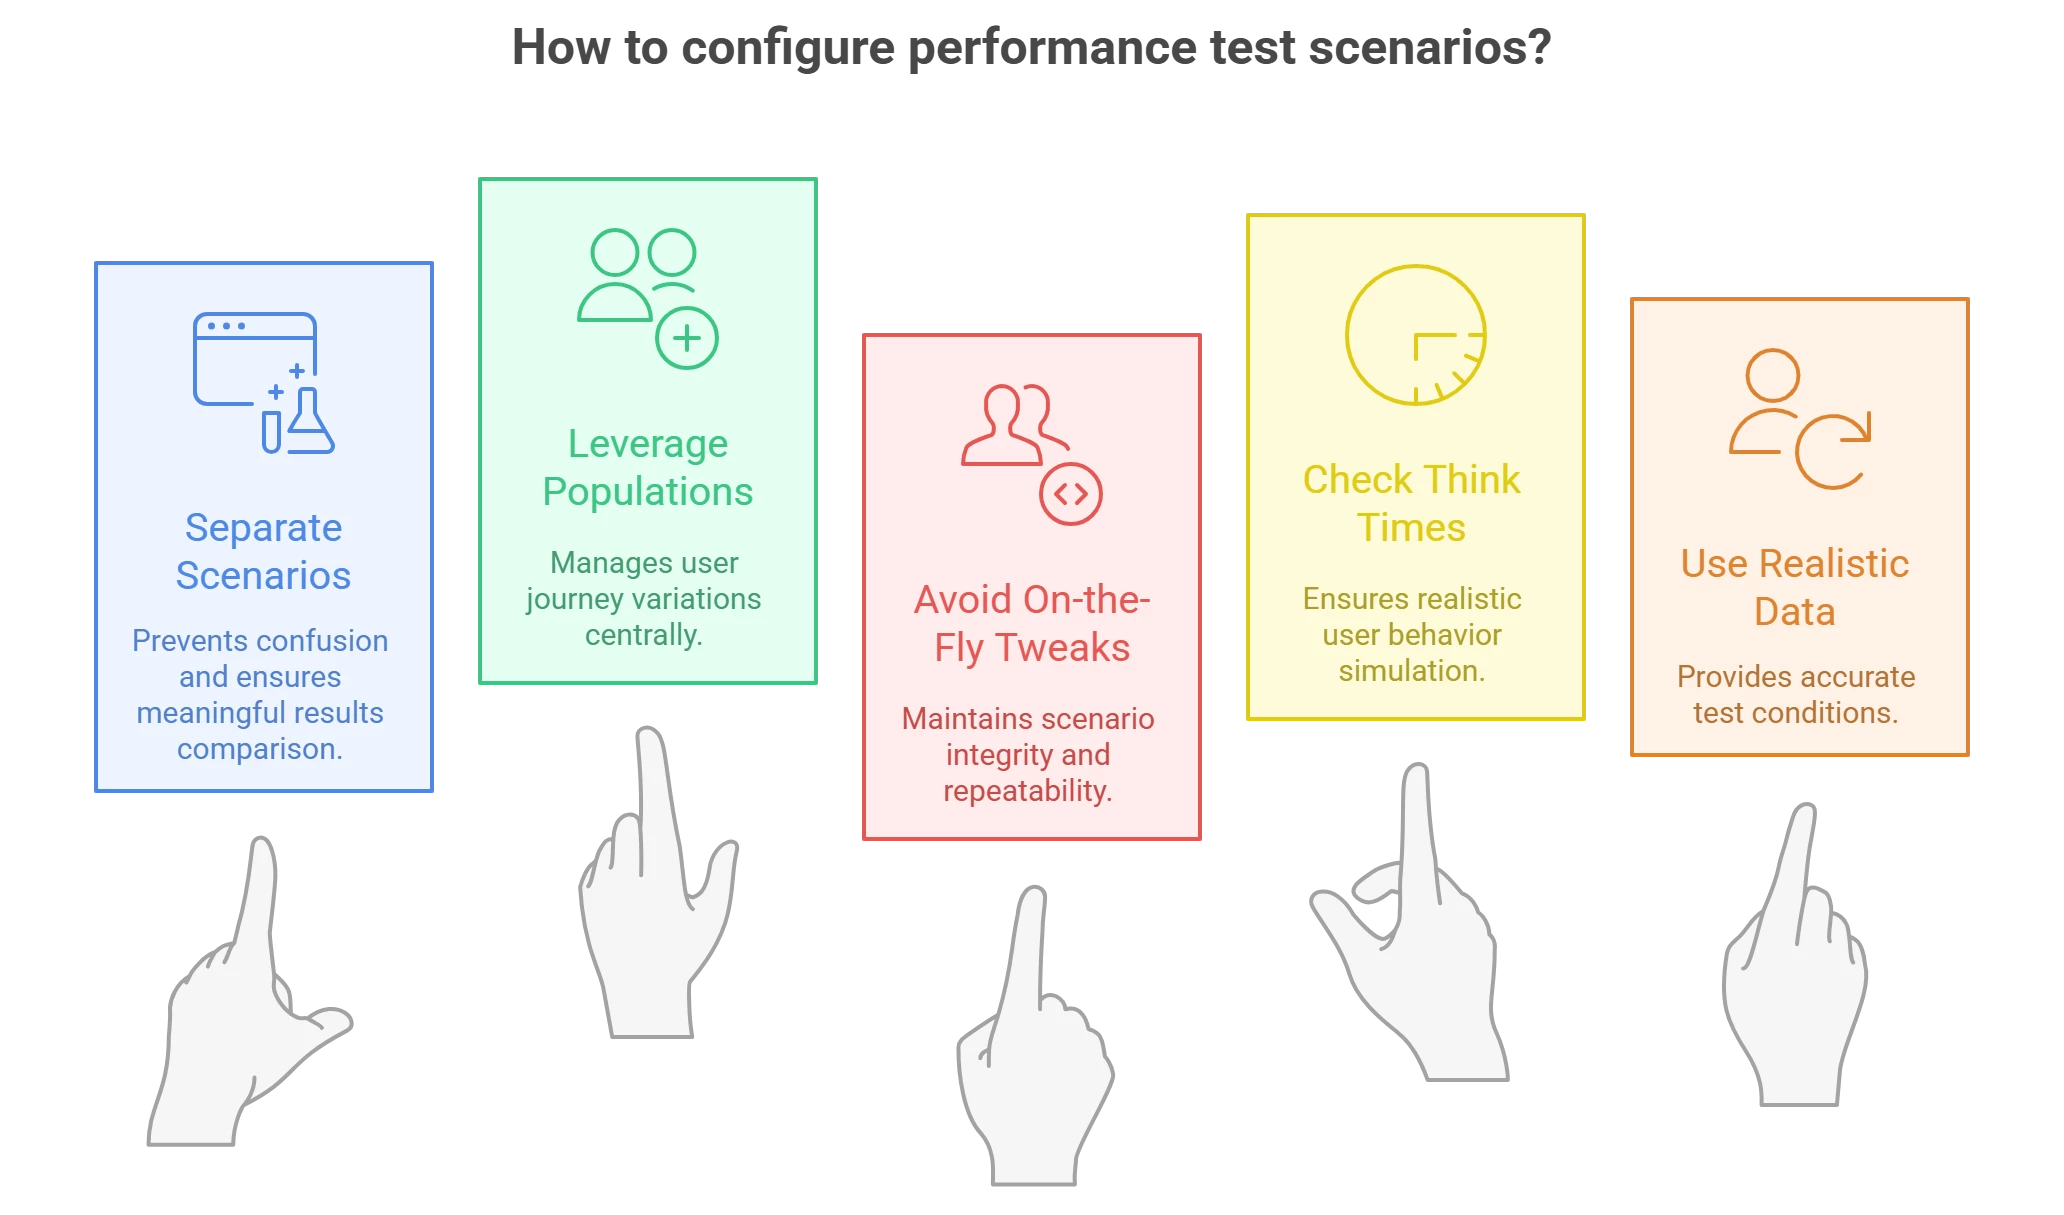
- Use Separate Scenarios for Different Goals: Don’t reuse one scenario and just tweak settings when you want to run a different kind of test. Instead, define distinct scenarios in NeoLoad for each major test profile (one for load test, one for stress, one for endurance, etc.). This was emphasized strongly in the webinar – separating scenarios prevents confusion, especially when you later compare results and trends. NeoLoad will by default trend results within the same scenario over time, but it will not mix results from different scenarios. By keeping, say, your “100-user load test” separate from your “1000-user stress test” scenario, you ensure that trend charts remain meaningful and aren’t plotting apples vs oranges on the same graph.
- Leverage Populations for Mixes and Overrides: If your test involves multiple user journeys, create a population for each mix. You can assign percentages of different user paths in one population to simulate realistic traffic distribution (e.g. 80% browse, 20% purchase). Also, use population settings to apply think time or pacing overrides globally. For example, you might have a “StandardUsers” population with normal think times, and a “ImpatientUsers” population identical except with think times divided by 10. This approach is cleaner than having to clone and edit numerous scripts; populations handle the variations centrally.
- Avoid On-the-Fly Tweaks to Running Scenarios: A common anti-pattern is to take a scenario configured for 500 users and just override the user count to 1000 at runtime when you want to push higher. The webinar cautioned that if you need a different user load or any major change, treat it as a different scenario in your design. For example, create a “Checkout_Load_500” and a “Checkout_Load_1000” scenario. This again helps with results comparison and repeatability – you know exactly what each scenario represents, and you can run them again later under the same conditions. NeoLoad (and any good tool) supports saving many scenarios, so take advantage of that.
- Check Your Recorded Think Times: As mentioned earlier, after recording a user path, review the think times. The presenter recommended cleaning up any abnormally long pauses that don’t reflect typical user behavior (like a 5-minute gap because you were distracted). Ensure the think times make sense (an average user might take 3-5 seconds on a simple page, maybe 10-30 seconds on a complex form). Adjust them if needed, or use NeoLoad’s ability to set a range (min-max) for think time to introduce realistic variability among virtual users.
- Use Realistic Data and Reset Conditions: (This is slightly beyond just NeoLoad config, but an important best practice.) When designing scenarios, consider test data management – ensure each virtual user has unique or properly reset data (e.g., unique login IDs, or reset carts) especially in an endurance test scenario. Also think about ramp-up and ramp-down – in a spike test scenario, for example, you might ramp instantaneously to N users, whereas in a load test you ramp gradually over 10 minutes. NeoLoad allows configuring these patterns in the scenario settings.
By structuring your NeoLoad project with these principles, you make scenario planning more efficient and your test results more insightful. Now, having set up robust scenarios, how do we integrate performance testing into our development lifecycle continuously, and make sure we’re testing the things that matter to the business? The next sections address these higher-level strategies.
Continuous Performance Testing in CI/CD Pipelines
In modern DevOps and agile environments, continuous performance testing is emerging as a best practice. The idea is to execute relevant performance tests as part of every build or deployment pipeline – right alongside unit tests and functional tests. This approach helps teams catch performance issues much earlier than traditional methods.
During the webinar, the expert noted that continuous performance testing is independent of specific tools or settings – it’s a process change. Even if you haven’t fully automated yet, simply running smaller performance tests more frequently (say, at the end of each sprint, or nightly) yields valuable trends over time. For example, you might run a 50-user baseline test against a key transaction with every code merge. If response times jump from 2 seconds to 3 seconds after a particular commit, you’ve caught a regression in near real-time, not weeks later.
Incorporating NeoLoad into CI/CD is facilitated by its integrations (NeoLoad has plugins for tools like Jenkins, Bamboo, Azure DevOps, etc.), but even without plugins, you can use NeoLoad’s CLI or API to trigger tests automatically. The goal is to provide rapid feedback to developers. As soon as a performance test fails (or even shows a warning trend), the team can investigate and fix the issue before it gets deeper into the release cycle. This is analogous to how a failed unit test prevents bad code from progressing – a failed performance check can prevent a slow or unstable build from being released.
Shifting performance tests left (earlier in development) often means testing at the component or API level, not only full end-to-end user journeys. The webinar distinguished system-centric testing vs user-experience-centric testing. In agile projects, you might test an individual microservice’s API for throughput and latency as soon as it’s built (system-centric), rather than waiting to test via the GUI after the whole system is integrated (user-centric). Both levels are important, but early system-level tests can pinpoint problems in isolation (like a slow database query in an API) and ensure each component meets its performance budget. An analogy given was car manufacturing: you test the engine, the brakes, etc., independently before testing the whole car. Likewise, test your “parts” (services, queries) under load in addition to full workflow tests.
It’s also worth creating baseline scenarios that you run continually. For instance, have a “Benchmark” scenario in NeoLoad that runs a quick sanity check (maybe 5 users for 5 minutes) against key endpoints. It won’t catch everything, but it can alert you to obvious performance deviations cheaply. Then schedule your heavier scenarios (load tests, stress tests) to run at larger intervals (e.g. nightly or weekly), or when significant changes occur.
Continuous performance testing requires a cultural shift – teams must treat performance metrics as first-class quality criteria. Over time, this practice builds a wealth of historical data. You can track trends like “release 2025.1 had 20% more throughput than 2024.4” or “memory usage has been creeping up 5% each build.” In the long run, such data informs better architectural decisions and capacity planning. It also de-risks releases because performance is verified at each step, not rolled in as a big question mark at the end.
Aligning Performance Tests with Business Goals
A performance engineering effort is most successful when it is aligned with what the business actually cares about. Too often, QA teams focus on technical metrics (TPS, CPU, memory) in a vacuum, without connecting to business outcomes. To plan effective scenarios, you should ask: What does the business consider “fast enough,” and what user actions are most critical to our success?
Start by translating vague requirements into concrete targets. If the product owner says “we need the app to be fast,” drill deeper: How fast? Under what load? It’s important to get specific numbers or at least ranges defined – for example, “Checkout should respond in under 3 seconds with up to 500 concurrent users.” In the webinar, the speaker noted that often business stakeholders don’t have a clear performance requirement defined upfront. They might say “we want it to be as fast as possible” – which isn’t actionable. As a performance engineer, you can facilitate an engaged conversation with the line of business to pin down these expectations. Bring data to the table: for instance, explain industry benchmarks or competitor performance. If you’re in e-commerce, remind them that users will compare your site’s speed to giants like Amazon or Walmart – you’re “in the same pond” competing on speed. Indeed, user tolerance for page load times has drastically decreased over the years: around year 2000, a 15-second page load was acceptable, by 2010 it was ~8 seconds, and by 2020 users expect ~2 seconds or less. Knowing this, the business might set a goal to stay under a 2-second response for key pages, which then becomes a requirement your tests can validate.
Aligning with business goals also means prioritizing what you test. Identify the critical user journeys (the ones tied to revenue, customer satisfaction, or regulatory compliance) and ensure your scenarios cover those thoroughly. For example, if you run an online banking app, the “deposit check” transaction might be crucial. The webinar mentioned a real case where a bank’s teller system had consistent 3-second response times, but users only felt it was slow during Friday lunch when lines were long – perception of performance can depend on context. The lesson: understand the business context of your performance metrics. A 3-second transaction might be fine until it impacts throughput (customers served per minute) when demand peaks. So you might need to test not just single-user response time but scenario throughput like “20 check deposits per minute” and see if that meets branch needs.
Another aspect is translating performance results into business terms. If a test shows the system can handle 200 users but fails at 300, communicate what that means: e.g., “Our online store can support about 50 orders/minute; beyond that, the checkout starts erroring out.” If the business expects more, then the conversation shifts to solutions – maybe investing in better infrastructure or optimizing code. Often there is a cost-speed tradeoff. Performance engineers should be prepared to present options: “To achieve 2s response at 1000 users, we may need to add a load balancer and two more app servers, which will cost $X”. Quantifying this helps the business make informed decisions. Aligning tests with business goals means you test what impacts the business and you report it in a way stakeholders understand (e.g. using dollars, conversion rates, or customer satisfaction, not just technical jargon).
Finally, ensure you loop in other teams like development and IT operations. Performance bottlenecks often span across application and infrastructure. Your ops team’s monitoring tools (APM solutions like Dynatrace, Datadog, etc.) can be used during tests to correlate metrics. Developers can help identify what “fast enough” is for new features if they have set internal targets (and if not, encourage them to do so). By fostering a performance-aware culture, everyone from dev to ops to business will consider performance early and define clear goals.
To sum up, performance scenario planning isn’t just an engineering exercise – it’s a collaboration with the business. Know what matters to your users and owners (response time, throughput, scalability, or all of the above), and design your NeoLoad scenarios to test those aspects. When you find issues, frame them in terms of business impact (“login takes 8 seconds – users may drop off”) to drive home the urgency.
Conclusion and Next Steps
Performance testing and scenario planning may seem complex, but with the right approach and tools like Tricentis NeoLoad, it becomes an achievable and insightful part of QA work. We’ve seen why continuous performance testing in any development model is critical, learned about various performance test types and when to use them, and explored how to implement these scenarios in NeoLoad with best practices around think time and test design. By aligning your performance tests with real-world usage and business goals, you ensure that the results you gather translate into actionable improvements and value for your organization.
Remember, effective performance engineering is an ongoing journey. Start small with continuous tests, iterate on your scenarios as the system and objectives evolve, and always communicate results in a business-friendly way. Over time, you’ll build confidence that every release is “fast enough” and scalable for your users.
To dive deeper and see these concepts in action, check out the on-demand webinar:
“Tricentis Expert Session: Tricentis NeoLoad and Performance Scenario Planning “.
It offers a wealth of insight into designing NeoLoad scenarios and overall strategy. You can view the session by clicking the link above.