Introduction
Tricentis NeoLoad is a performance testing tool for simulating load on applications, while Dynatrace is a leading Application Performance Monitoring (APM) platform. Integrating NeoLoad with Dynatrace allows QA teams and developers to combine load testing with deep monitoring, providing end-to-end visibility into system behavior under stress. In a recent Tricentis Expert Session webinar, experts demonstrated how NeoLoad’s Dynatrace integration works and explained why it’s beneficial. The integration is bidirectional: NeoLoad can push test context into Dynatrace, and Dynatrace metrics can be pulled into NeoLoad for analysis. This means as a load test runs, Dynatrace recognizes the test traffic and collects detailed telemetry, and NeoLoad concurrently fetches infrastructure metrics and alerts from Dynatrace. The result is richer performance test results and faster identification of bottlenecks.
Architecture: The NeoLoad-Dynatrace integration inserts a special header into every test request, which Dynatrace’s OneAgent on the application server intercepts. NeoLoad also uses Dynatrace’s API to retrieve system metrics (CPU, memory, etc.) and to push test-related tags or alert rules. In this diagram, NeoLoad (left) generates load against the Application Under Test (middle). Each request includes an X-Dynatrace-Test header containing the test, transaction, and virtual user info. Dynatrace’s OneAgent on the target servers detects these headers and tags the transactions in Dynatrace. Meanwhile, NeoLoad connects to the Dynatrace API (right) to pull real-time monitoring data and to inject events like anomaly detection rules. This two-way data exchange ensures that Dynatrace and NeoLoad stay in sync during the test. Dynatrace can even auto-create dashboards or events for the test run, while NeoLoad’s results get enriched with Dynatrace’s observations.

Business Benefits of NeoLoad-Dynatrace Integration
Integrating NeoLoad with Dynatrace provides significant benefits for both QA and operations teams:
-
Shared Visibility and Collaboration: Performance engineers and IT operations can each use their preferred tools (NeoLoad and Dynatrace) yet see the same performance data in real time. NeoLoad’s test report is populated with Dynatrace metrics, and Dynatrace’s dashboards show NeoLoad’s test activity. This common view breaks down silos – both teams can watch the test as it runs without needing special access or training in the other tool. As the webinar noted, a “hidden benefit” of this integration is improved collaboration between performance testers and ops, who both ultimately want fast, reliable applications.
-
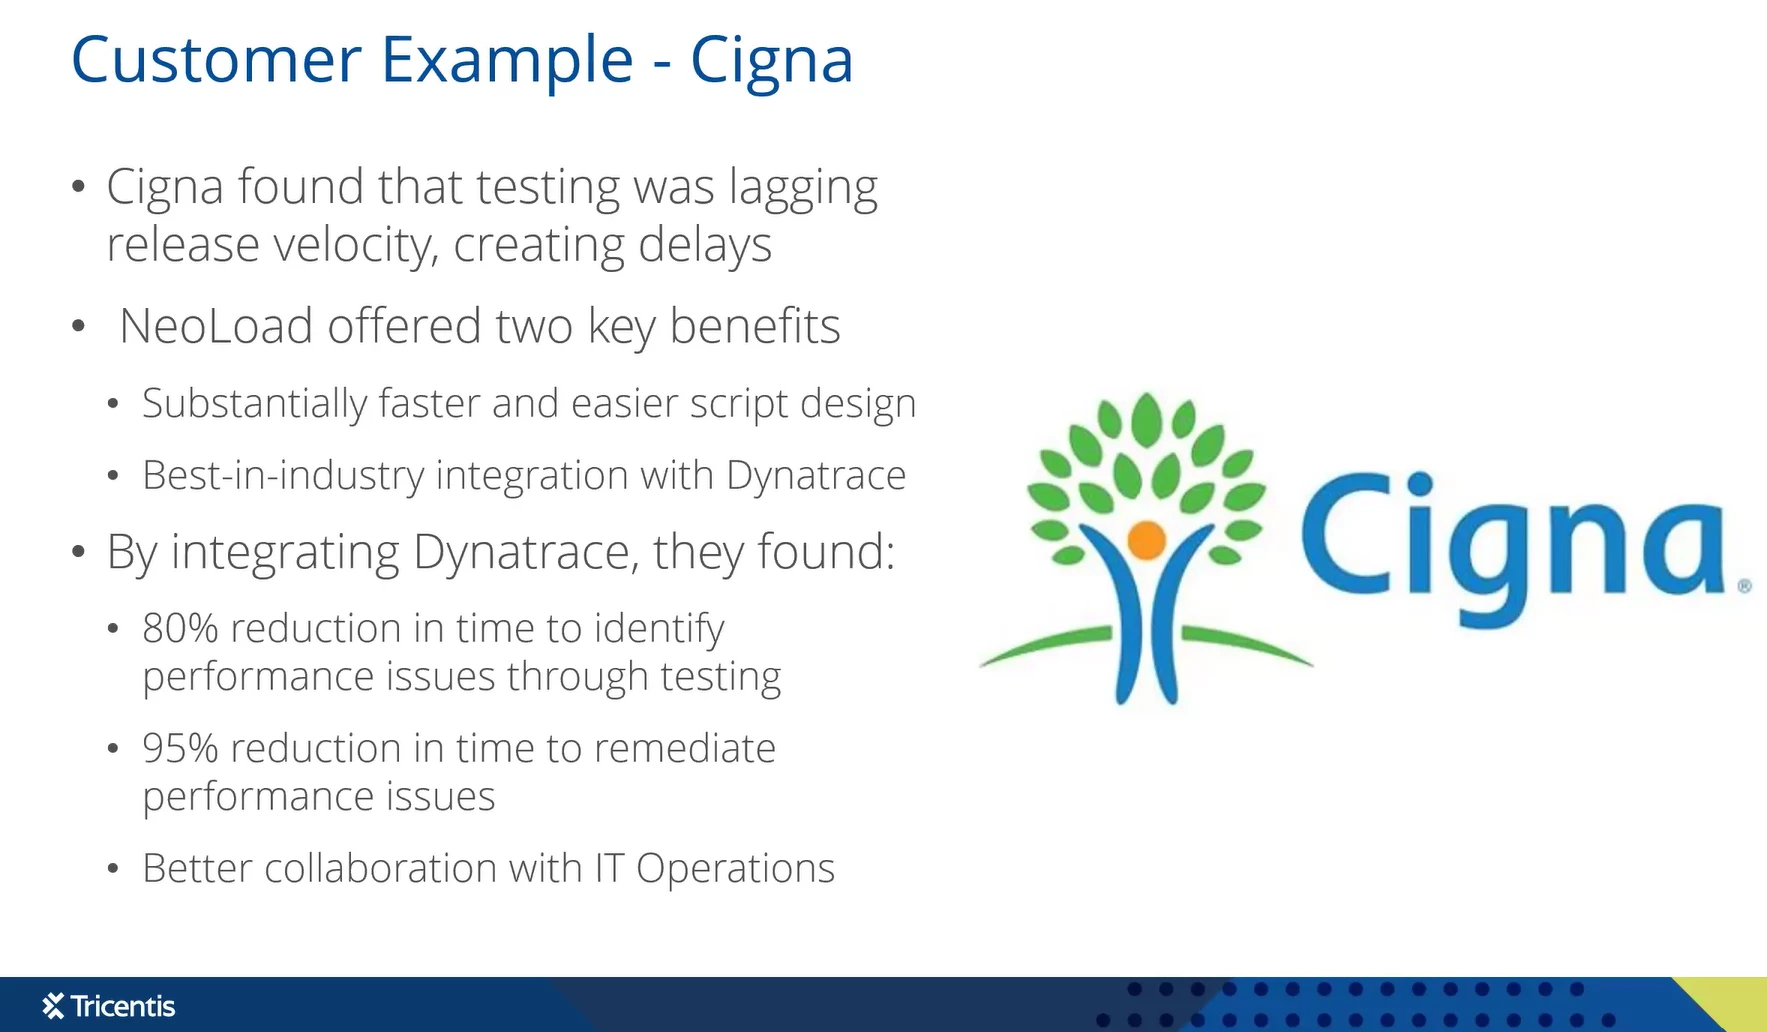
Faster Issue Detection and Root Cause Analysis: Dynatrace’s detailed monitoring (with traces, host metrics, etc.) accelerates the detection and diagnosis of performance issues during a load test. One enterprise that adopted NeoLoad’s Dynatrace integration saw the time to identify performance problems drop by over 80%, and time to pinpoint and fix the root cause shrink by 95%. Instead of just knowing a slowdown occurred, the team can immediately see why – for example, spotting a spike in database CPU or an external call latency correlated with the slow transaction. Dynatrace’s AI assists by correlating anomalies across the stack, so testers spend less time guessing and more time solving the right problem.
-
Early Risk Detection in Pre-Production: With APM instrumentation in place, performance tests in QA/staging environments reveal issues long before production. Dynatrace maps all the components of the application’s architecture (the “Smartscape”), so a load test can expose architectural weaknesses under load. Operations teams gain confidence because they witness the application’s behavior under stress prior to go-live. If build 2.3.1 suddenly consumes more CPU or memory than 2.3.0 during tests, Dynatrace will flag it, enabling proactive tuning by developers before release. This practice prevents unpleasant surprises in production and ensures smoother deployments.
-
Deeper Insights and Context for Performance Results: Marrying load test results with APM data provides context that pure load metrics alone cannot. NeoLoad might tell you a login transaction slowed down at high load, but Dynatrace can reveal why – perhaps an authentication service call took longer due to a misconfigured Kubernetes pod limit. As the Tricentis webinar emphasized, using Dynatrace means the difference between simply knowing “login is slow” and knowing “login is slow because the Kerberos authentication call was delayed by CPU throttling on the auth server”. Such insight is invaluable for pinpointing bottlenecks quickly and accurately. It elevates the analysis from symptoms to root causes.
-
Automated Anomaly Detection: The integration allows defining test-specific alert thresholds (anomaly detection rules) that Dynatrace will monitor during the test. NeoLoad can push these rules (e.g., “alert if CPU idle % drops below 12% on any app server”) at the start of the test. If the condition is met, Dynatrace triggers an alert in its problem feed, highlighting a performance regression or issue immediately. These dynamic alerts disappear after the test ends (NeoLoad removes them) to avoid cluttering Dynatrace. This automation means you don’t have to manually watch every graph – the system will call out significant anomalies in real time.
Setting Up NeoLoad with Dynatrace – Step by Step
The webinar walked through how to configure the NeoLoad-Dynatrace integration from scratch. Here are the key steps to implement it:
-
Install Dynatrace OneAgent on the Test Environment: Ensure that the application under test (in your QA or staging environment) is fully monitored by Dynatrace. Dynatrace’s OneAgent must be installed on all servers, containers, or services that NeoLoad will exercise. This instrumentation is essential – it allows Dynatrace to trace transactions and collect infrastructure metrics during the performance test. (In practice, teams often automate OneAgent deployment as part of environment setup, especially in ephemeral CI/CD test environments.)
-
Obtain a Dynatrace API Token with Required Permissions: NeoLoad connects to Dynatrace via API, so you need to create an API access token in Dynatrace with the correct scopes. In the Dynatrace web UI, go to Manage → Access Tokens (under settings) and generate a new token. The token must include the following permissions for full integration functionality:
-
Access problem and event feed, metrics, and topology – (to read metrics and events)
-
Capture request data – (to tag and identify NeoLoad’s test traffic)
-
Read configuration & Write configuration – (to create anomaly detection rules programmatically)
-
Read entities (API v2) & Write entities (API v2) – (to fetch info on monitored entities and to delete test-related tags at the end)
Save this API token – you’ll enter it into NeoLoad shortly.
-
-
Enable the Dynatrace Integration in NeoLoad: Open your NeoLoad project and navigate to Edit → Preferences → Project Settings → Dynatrace. Check the option “Enable Dynatrace integration” (or similar wording). Then enter your Dynatrace environment’s URL (e.g. the SaaS tenant URL) and paste the API token you created. These settings are saved per NeoLoad project, allowing different projects to target different Dynatrace environments if needed. Enabling this tells NeoLoad to start injecting the Dynatrace header into test traffic and to communicate with Dynatrace during test execution.
-
(Optional) Tag the Application Entry Point in Dynatrace: In Dynatrace, it’s recommended to tag the primary service or front-end component of your application under test (for example, the web server or API endpoint that receives the load test traffic). You might apply a tag like “NeoLoad-test” or an “Environment:PerformanceTest” label on that service. This isn’t strictly required, but doing so helps Dynatrace auto-isolate and group all related components in its Smartscape view when the test runs. Once the entry point is tagged, Dynatrace’s automatic topology mapping will cascade that context to connected services, so that all calls originating from NeoLoad test traffic carry a “NeoLoad” marker through the system.
-
Add a Dynatrace Monitor in NeoLoad: Next, configure NeoLoad to pull metrics from Dynatrace during the test. In NeoLoad, go to Design → Monitors & Devices (Monitors tab), and add a new Monitored Machine. Choose the Dynatrace monitor type. (NeoLoad will use the Dynatrace URL and token from the project preferences.) You can select which Dynatrace metrics or hosts to monitor – for example, CPU, memory, garbage collection, database response time, etc., on the servers under test. Once set up, this NeoLoad “Dynatrace monitor” will query Dynatrace for those metrics at runtime and include them in your NeoLoad test results. Essentially, NeoLoad becomes a client of Dynatrace’s metrics API during the test run.
-
Run the Performance Test: Execute your NeoLoad scenario as usual (via NeoLoad Controller or NeoLoad Web). With integration enabled, NeoLoad automatically adds an extra HTTP header to every request it sends to the application. This header is called X-Dynatrace-Test and it encodes information like the test scenario name, virtual user ID, transaction name, etc.. (For example, a request header might look like:
X-Dynatrace-Test: SI=NeoLoad; VU=5; SN=CheckoutFlow; PC=/login; ID=42; NA=LoginTransaction; GR=US_East; TE=SampleProject-Scenario1-<TestID>.) The application under test will typically ignore this header, but Dynatrace’s OneAgent sees it and logs the details. Dynatrace automatically creates request attributes for NeoLoad traffic, labeling each request with properties like “NeoLoad_ScenarioName” and “NeoLoad_Transaction” for easy filtering. As the test runs, you should start seeing live metrics in both tools: -
-
In NeoLoad: Live graphs will include Dynatrace metrics (CPU, memory, etc.) alongside the usual response times and throughput. You might see these in the NeoLoad Controller or NeoLoad Web dashboard updated in real time.
-
In Dynatrace: The tool detects that a load test is in progress. Dynatrace may automatically highlight the test in its interface – for instance, it can create a dedicated event or dashboard indicating a performance test is running. All requests from NeoLoad are tagged, so you can filter Dynatrace’s views to just the test’s traffic. The Dynatrace UI will show service call response times, error rates, and infrastructure metrics, scoped specifically to the NeoLoad test execution.
Example: A Dynatrace dashboard showing a NeoLoad test in progress. The top chart displays the number of virtual users (blue line) and any errors (red line), while the bottom chart shows transaction throughput (green line) during the test. Dynatrace provides out-of-the-box visualizations for NeoLoad integration, so operations engineers can watch the load test’s impact on the system in real time. In this example, the Dynatrace dashboard tracks how the virtual user load correlates with error rates and transaction rates, offering immediate insight into performance behavior under load. (NeoLoad and Dynatrace each have all the key performance indicators, enabling both teams to “have their KPIs to analyze and make automated decisions” during the test.)
-
-
(Optional) Configure Anomaly Detection (Dynamic Alerts): One powerful feature is the ability to set up test-specific alerts. In NeoLoad, you can define SLA or anomaly thresholds as part of the scenario. For example, you might require that CPU usage on any app server should not exceed 85%, or that login transaction response time should not go beyond 3 seconds under load. With the Dynatrace integration, these can be translated into Dynatrace custom alerts that activate only for the duration of the test. In NeoLoad, go to Runtime → Scenario Settings (Advanced) → APM and add an anomaly detection rule with your criteria. When the test starts, NeoLoad will instruct Dynatrace to create a corresponding alert rule internally. If the condition is violated during the test, Dynatrace will generate a problem event (which can be seen in Dynatrace’s Problems feed or alerts). This is extremely useful for catching performance regressions automatically. At the end of the test, NeoLoad removes the rule from Dynatrace, keeping the APM environment clean. Essentially, your performance test can “ask” Dynatrace to watch for certain issues (high error rates, resource saturation, etc.) and flag them without manual monitoring.
-
Analyze Results and Tune: After the test, analyze the combined data. NeoLoad’s results will include graphs of both the user experience (response times, throughput) and the server-side metrics pulled from Dynatrace. You can easily correlate a response time spike with a CPU spike on a particular server, for instance. Meanwhile, in Dynatrace, you can investigate any problem cards or anomalies detected during the test, and use Dynatrace’s distributed tracing (PurePath) to drill into specific transactions. The collaborative nature of the integration means developers, testers, and ops can all discuss the same incident with full context. For example, if Dynatrace’s AI identifies that a database query caused a slowdown at 500 concurrent users, the team can focus on that query. Without APM, the tester might only know “500 users caused a slowdown” and would have to do further profiling. With Dynatrace, a lot of that detective work is already done by the tool’s analytics.
Use Cases and Best Practices for APM Integration in Performance Testing
Key Use Cases: Beyond the general benefits, it’s helpful to consider specific scenarios where NeoLoad-Dynatrace integration shines:
-
Rapid Root-Cause Isolation: Suppose a critical transaction’s response time jumps during a stress test. With Dynatrace, you can immediately see which tier is responsible – e.g., the slowdown is due to an external API call waiting on a third-party service, or due to garbage collection pauses on the app server. The integration tags the exact requests, so Dynatrace can show you a trace of the slow transaction pinpointing the slow method or SQL query. In the webinar, the team demonstrated how a complex issue (a Kerberos authentication delay due to CPU limits) was identified through Dynatrace data, which would have been extremely difficult to catch with just load testing scripts.
-
Proactive Performance Regression Detection: In automated CI pipelines, you can include a NeoLoad test and fail the build if performance degrades. The NeoLoad-Dynatrace integration makes this more robust by using Dynatrace’s anomaly detection. For example, if a new build causes memory usage to climb 20% higher than previous runs, Dynatrace can detect that anomaly automatically. This way, performance regressions trigger immediate feedback. Some teams integrate Dynatrace’s problem alerts with their build process – if Dynatrace flags a problem during the test, the pipeline can mark the test as failed. This ensures no code change that hurts performance goes unnoticed.
-
Live Team Collaboration During Tests: A common practice with this integration is to have both QA and ops team members jointly watch a test in real time. The QA engineer monitors NeoLoad’s live graphs (seeing response times and throughput) while an ops engineer watches Dynatrace (seeing system health indicators). They’re effectively looking at two sides of the same coin. For instance, if errors start spiking at a certain load, the ops person might see in Dynatrace that one of the microservices threw exceptions or a server’s CPU hit 100%. Both perspectives together paint a complete picture, and decisions (like to stop the test, log a defect, or investigate further) can be made on the spot. This real-time collaboration was highlighted in the expert session as a way to eliminate miscommunication and “use a common language” between teams.
-
Capacity Planning and Tuning: Dynatrace integration helps not only find problems but also optimize and tune systems. After a test, the detailed metrics might reveal that a certain service consistently hits 80% CPU at peak load while another stays at 20%. This could indicate an opportunity to reallocate resources or adjust the autoscaling configuration. By repeatedly testing with NeoLoad and observing Dynatrace metrics, teams can iteratively tune their infrastructure for optimal performance. Dynatrace’s data can also feed into capacity planning models – e.g., predicting how much more load the system can handle before hitting a bottleneck, based on current utilization trends.

Best Practices: To get the most out of integrating an APM tool like Dynatrace with performance testing, consider these best practices:
-
Plan Monitoring with the End in Mind: Before running tests, decide what success looks like and what metrics matter most. Engage your Ops/DevOps colleagues early – they can advise which system metrics or transactions are key to watch. Establish clear performance SLAs and use Dynatrace to keep an eye on those (for example, use Dynatrace’s “Key Transactions” or service-level objectives in addition to NeoLoad’s SLAs). Having predefined objectives helps in configuring meaningful anomaly detection rules and focusing on the right data during analysis.
-
Leverage Tagging and Filtering: Take advantage of Dynatrace’s tagging to differentiate test environment data. The NeoLoad integration automatically tags requests with scenario and transaction names, which is extremely helpful. You should also ensure your test environment services are labeled (e.g., tag your Dynatrace services with “Environment:Staging” or similar) so that there’s no confusion between production and test traffic. Dynatrace’s tagging engine is very powerful, letting you slice data by application, by host, by data center, etc.. Use it to your advantage – for example, filter Dynatrace dashboards to only show “NeoLoad requests” to easily analyze test impact.
-
Monitor Broadly, Then Drill Down: It’s often said in performance engineering that you should collect as much data as possible – until it becomes overwhelming. Dynatrace helps by automatically monitoring a wide array of metrics out-of-the-box (CPU, memory, disk, network, response times, errors, and more). When you first run a test, include a broad set of monitors. If the test fails or something looks off, you likely already have the data in Dynatrace to diagnose it. As mentioned in the webinar, a common challenge is running a test and finding a problem but missing some crucial monitoring data, forcing a retest. Dynatrace’s comprehensive approach mitigates this – it might have already recorded garbage collection times or thread pool saturation that you didn’t think to check. Use Dynatrace’s analysis tools (like the “Problems” view or Smartscape) to spot anomalies you weren’t even specifically looking for.
-
Use Dynatrace’s AI and Insights: Dynatrace’s built-in AI (Davis) will automatically analyze causal chains when a problem is detected. For example, if response times start increasing and it correlates with a spike in garbage collection time on one of the servers, Dynatrace will detect that correlation and potentially raise a Problem indicating something like “Service response time degraded due to high GC activity on Service XYZ.” The NeoLoad integration ensures that these problems are test-specific (because of the tagging), so you won’t confuse test issues with unrelated issues. Davis can also help perform root cause analysis: it looks at the service flow and finds the causal node (e.g., the database or an external call causing a slowdown). This drastically reduces the time the team spends troubleshooting. The webinar conclusion gave a vivid example – with Dynatrace data, you don’t just see that a certain step failed; you learn exactly which component caused it and why. Make sure to review Dynatrace’s Problems and Service analysis after a test – the insights can be incredibly rich when combined with your NeoLoad results.
-
Automate and Integrate into CI/CD: Treat the NeoLoad-Dynatrace setup as code. For example, you can script NeoLoad’s CLI or as-code framework to start tests with Dynatrace integration enabled, and use Dynatrace’s API to pull results or confirm no problems occurred. Some advanced teams feed Dynatrace data back into test reports or even into bug-tracking systems automatically. The end goal is a continuous performance feedback loop: every new build gets a quick performance test, monitored by Dynatrace, and any regression triggers an immediate alert or a failure in the pipeline. Over time this practice can dramatically improve the performance reliability of your releases because issues are caught early and consistently.
-
Keep Monitoring Overhead Minimal (Don’t Disable APM in Tests): One concern teams sometimes have is whether running an APM agent during a load test will skew results or add overhead on the system. With Dynatrace OneAgent, the overhead is designed to be minimal – typically just a few percent of CPU, and it dynamically adjusts to minimize impact. The agent is built to run in production full-time, so running it in a test environment is usually fine. As long as your test environment isn’t maxed out on resources to begin with, the overhead of monitoring should not meaningfully alter your test outcomes. A Dynatrace engineer noted that overhead will be low unless the machine is already at its limits (in which case any extra work could tip it over). In short, don’t shy away from using the integration due to overhead fears – the visibility you gain is worth it. Just ensure your load generator machines and application servers have a bit of headroom, which is a good practice regardless.
By following these practices – collaborating across teams, using tagging and automation, and harnessing Dynatrace’s analytics – you can elevate your performance testing to be more proactive and data-driven. The integration essentially brings production-level monitoring into your test lab, enabling what some call “shift-right” observability in pre-prod.
Conclusion and Next Steps
Tricentis NeoLoad’s integration with Dynatrace demonstrates how combining load testing with observability leads to better software outcomes. It provides a 360° view of performance: from end-user experience metrics to deep-dive technical metrics – all aligned by the common context of the test scenario. Teams that have adopted this integration report faster troubleshooting, improved collaboration, and greater confidence in application performance before release. Implementing the integration is straightforward (it can be as simple as checking a box in NeoLoad and providing a token), yet the payoff is substantial – “the integration [is] spectacular, crazy easy to set up, and incredibly useful… it just makes NeoLoad work so much better. Everything gets better when you do it”.
If you’re interested in seeing this integration in action and learning more tips, be sure to watch the full webinar “Tricentis Expert Session: Tricentis NeoLoad and the Importance of APM Integrations Featuring Dynatrace”. The on-demand recording is available via the Tricentis Academy portal (link below). It’s a great resource to solidify these concepts with a live demo and Q&A discussion.
To learn more and see a live demo, we encourage you to watch the full webinar “Tricentis Expert Session: Tricentis NeoLoad and the Importance of APM Integrations Featuring Dynatrace”. The experts in that session cover this topic and more, with hands-on examples and additional insights.


