


NeoLoad Web’s next-generation UI (2025.1+) introduces Augmented Analysis
Which is a machine‑learning assistant that segments your run into color‑coded intervals and flags where performance holds, changes, or degrades based on RED metrics (Rate, Errors, Duration). It’s paired with a V4 API and an API‑first architecture so you can automate analysis, reporting, and governance at CI/CD speed.
Why this matters now
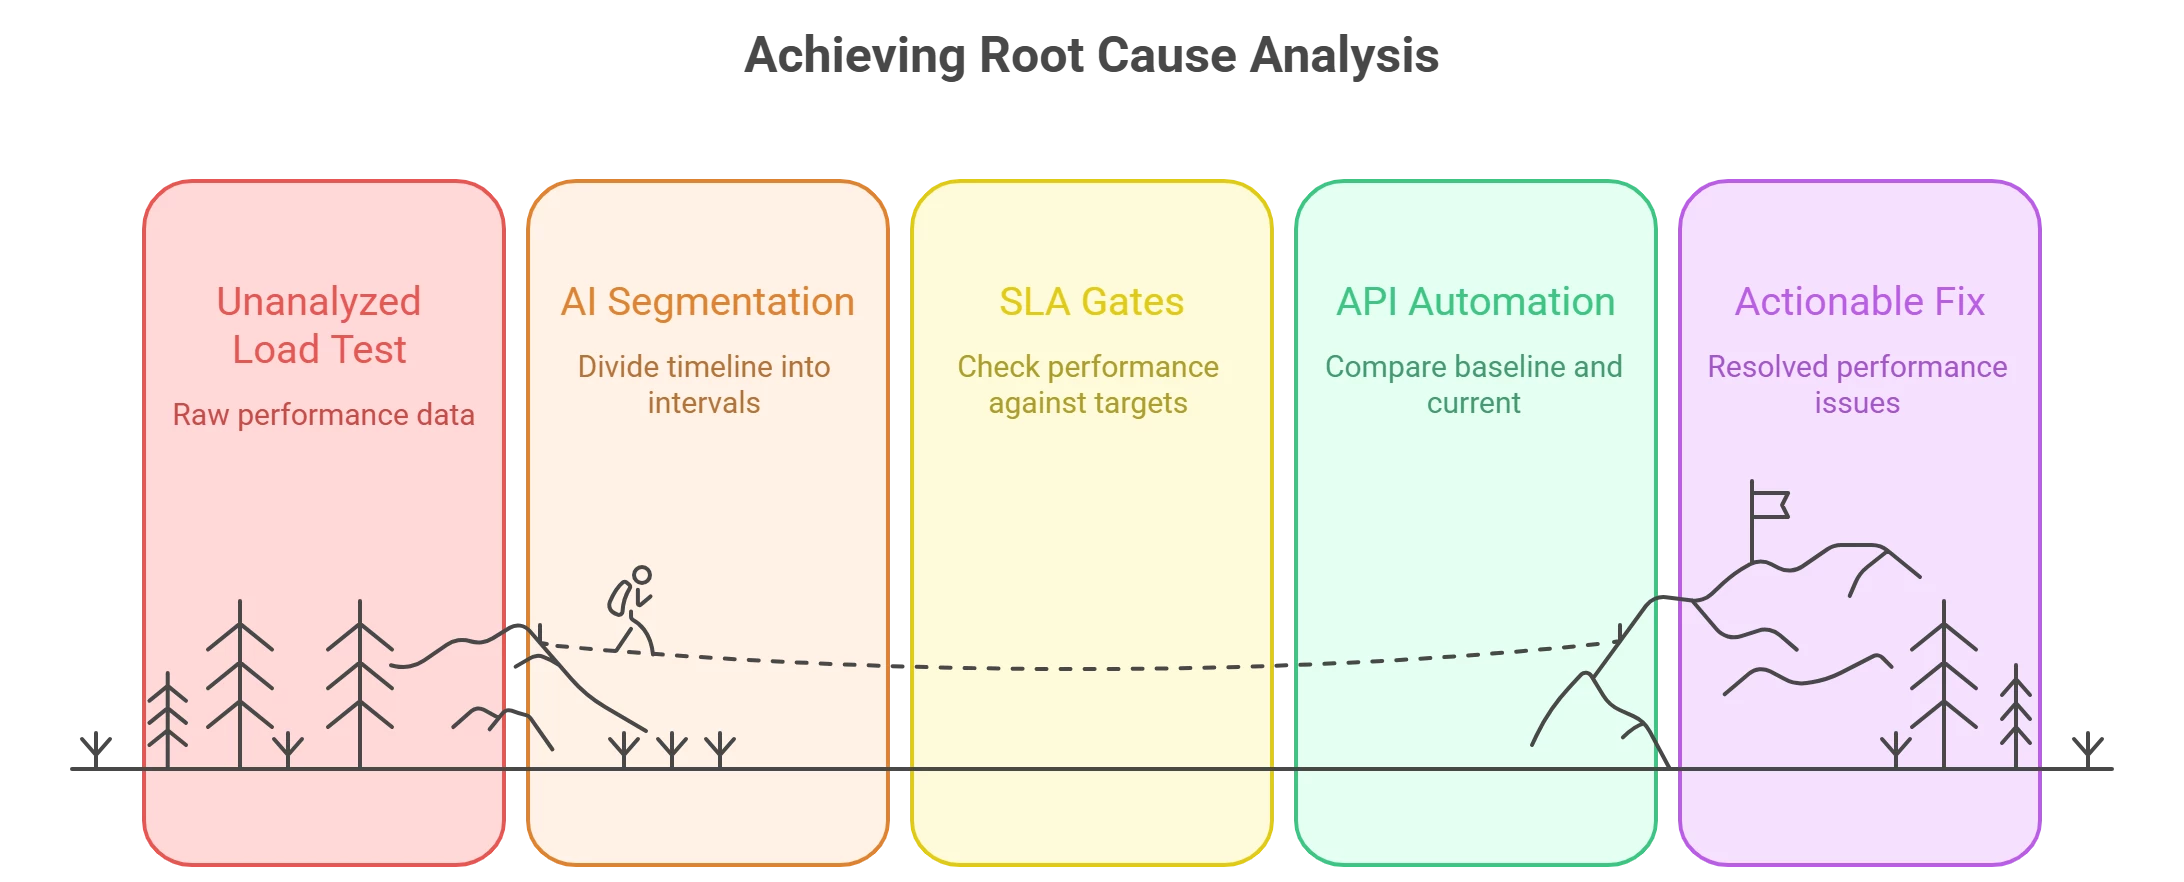
In a shift‑left world, performance testing isn’t a once‑per‑release event: engineers see multiple test results per hour as pipelines auto‑trigger runs across services and APIs. The challenge has moved from running tests to prioritizing analysis—finding the few minutes in a long timeline where things truly go wrong. Augmented Analysis attacks exactly that problem.
What Augmented Analysis does (and doesn’t)
What it is:
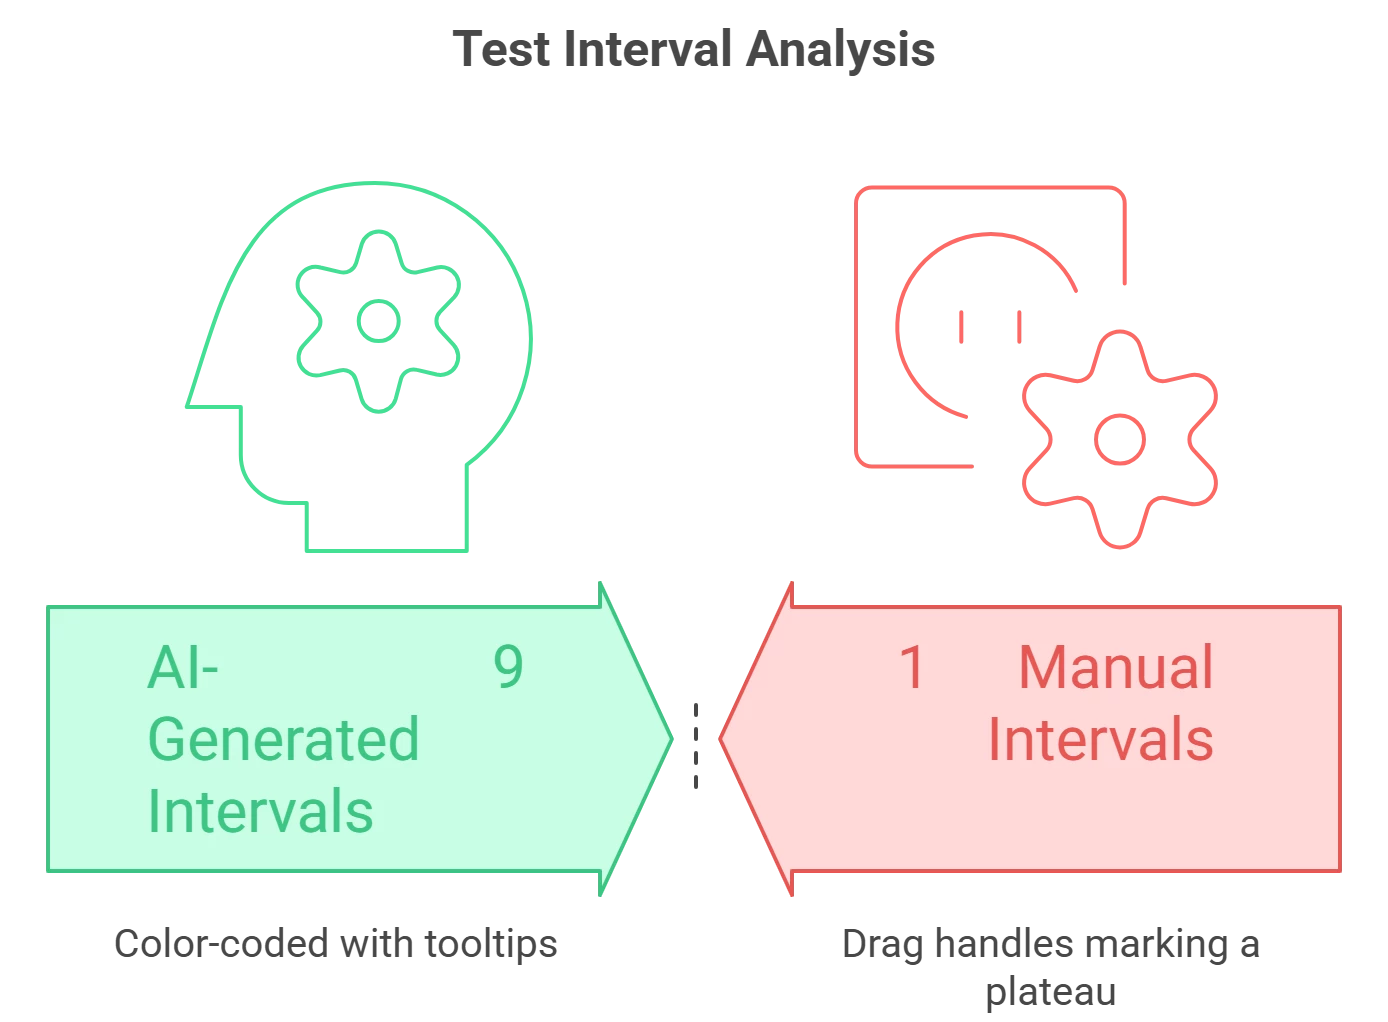
In NeoLoad Web 2025.1, Augmented Analysis automatically partitions a test run into intervals and labels them (e.g., stable under increased load, no significant change, degrading under ramp). It focuses on RED metrics that exist in every result set, so it works across protocols and scenarios without custom setup.
What it isn’t:
It’s not a “magic fix” or a generative summary of your test; NeoLoad uses ML to surface where to look first so experts (or your pipeline) can act faster. You still apply domain context, SLAs/SLOs, and monitoring data to determine business impact.
Teams can also create manual intervals (drag to isolate plateau vs. ramp) and NeoLoad recalculates metrics for that window—making apples‑to‑apples comparisons trivial (e.g., 100 VU plateau vs. 200 VU plateau). Intervals are treated “as if time index = 0,” so segment‑to‑segment overlays align neatly.
A quick tour of what’s new in NeoLoad Web 2025.1
- Next‑gen NeoLoad Web (kept alongside classic): Tricentis shipped a modernized UI and architecture while maintaining the classic interface for continuity. You can switch between them as needed.
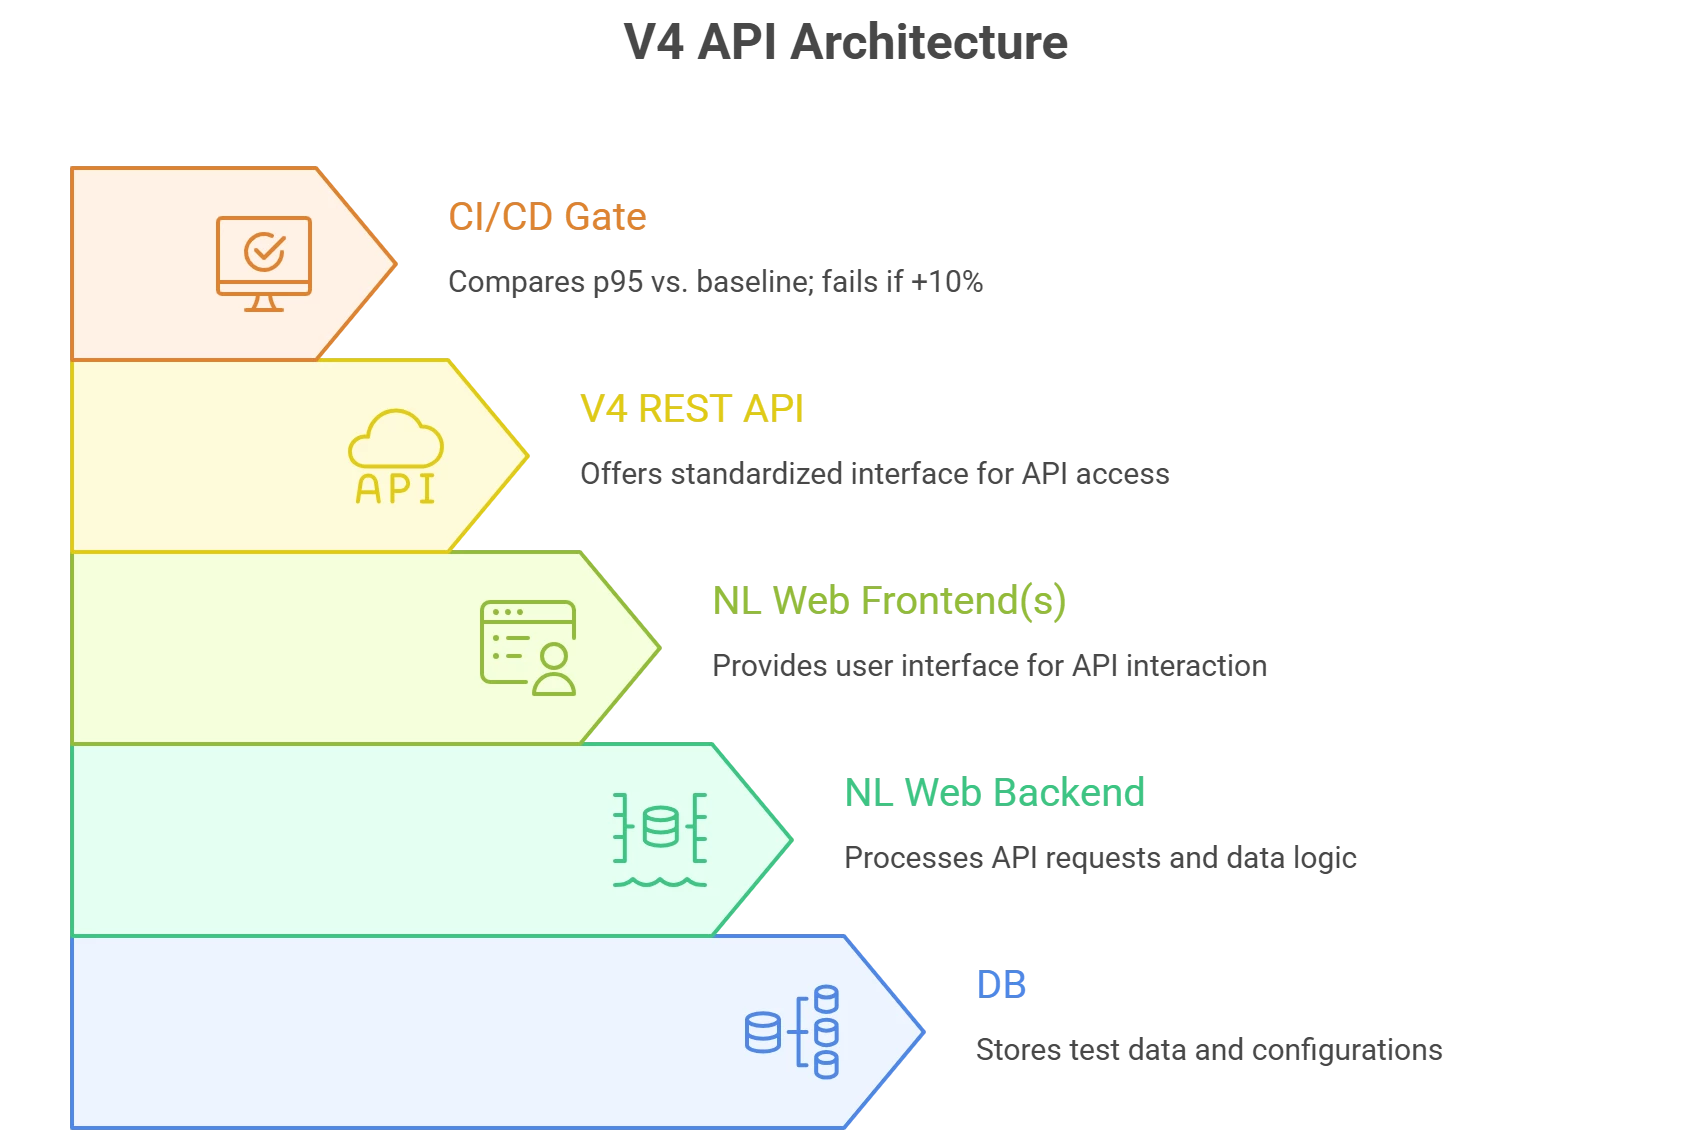
- API‑first with V4 API: The platform’s capabilities are exposed programmatically—roles/workspaces, reporting, interval access/management, and more—enabling end‑to‑end automation in CI/CD.
- ML‑powered Augmented Analysis (technical preview in 2025.1): Initial scope on RED metrics, with a roadmap to incorporate NeoLoad project details and APM/monitoring data.
In practice:
the webinar demo (linked below) shows AI‑generated intervals flagging ramp‑up degradation and helping pinpoint the failure region (e.g., around a certain concurrent user range), accelerating triage for the performance engineer.
Designing for continuous performance
Shift‑left analysis at scale. As developers and pipelines generate more runs, analysis must scale too. Augmented Analysis provides an initial triage, while trending and SLA/SLO checks keep a watch on regressions over time.
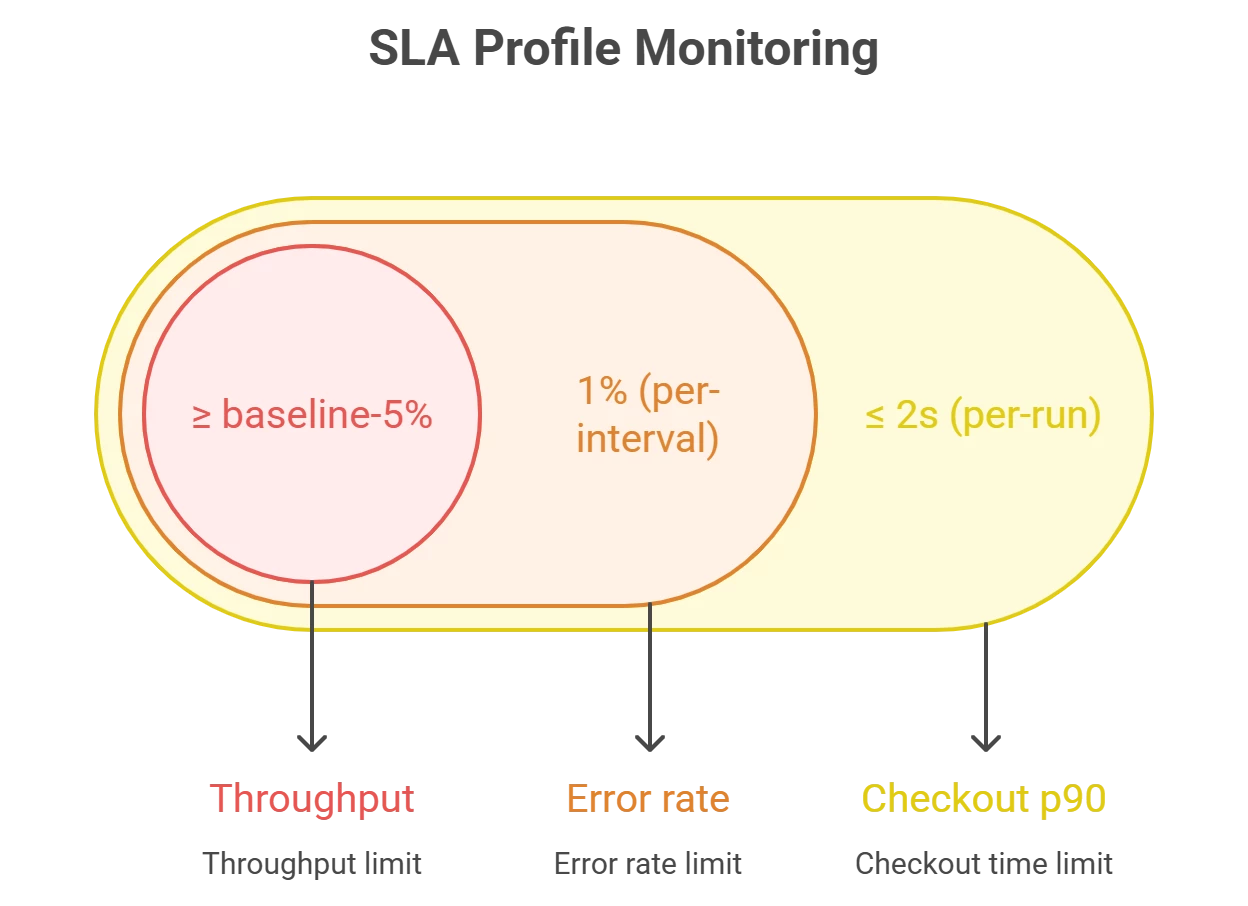
Percentiles, not averages. NeoLoad lets you define percentiles in results (commonly p90/p95/p99) and set SLA profiles to gate outcomes by metric and scope (per‑run or per‑interval) with real‑time alerts in runtime. That way, “rare but real” slow paths aren’t hidden by averages.
API‑driven governance. With the V4 API and community utilities, you can compare a run to a baseline on p90/p95/p99 and fail the pipeline if thresholds are exceeded—no one manually sifts graphs at 2 a.m.
Bringing monitoring into the picture
NeoLoad’s integrations let you correlate test‑side RED metrics with infra/app telemetry:
- Dynatrace: Bi‑directional tagging and data exchange, including auto‑tagging services in Smartscape; configure via project and scenario to pull service/process/host metrics into results.
- Datadog: An official integration surfaces NeoLoad metrics (throughput, requests/sec, errors, users) and test events in Datadog dashboards.
- Prometheus (community action): Pull Prometheus counters into NeoLoad’s External Data to align backend signals with load phases.
Tricentis has also communicated expanding Augmented Analysis beyond RED metrics to include project detail and APM/monitoring signals, and complementary Augmented Design capabilities for smarter scripting and reproduction of tricky correlations.
Real‑world reminder: plan for peaks, not just steady state
Live events are unforgiving. Netflix’s Jake Paul vs. Mike Tyson stream (Nov 2024) drew unprecedented traffic and widely reported buffering/quality issues—an object lesson in planning for non‑linear demand spikes and ensuring observability and auto‑tuning under surge concurrency.
Augmented Analysis plus trend baselines, SLA gates, and APM correlation help performance teams spot early regressions—and design tests that mimic flash‑crowd behavior before marketing lights the match.
A practical, minimal‑friction rollout plan
- Codify SLAs/SLOs. Create SLA profiles for key user paths and APIs (e.g., Login p90 ≤ 2s at 250 concurrent users; Checkout error rate < 1%) and apply them per run and per interval. Enable runtime alerts.
- Use intervals intentionally.
- Manual: Mark plateaus and “stepping points” to cleanly compare behavior across loads.
- Auto (AI): Let Augmented Analysis segment runs and start with the red zones.
NeoLoad recalculates metrics per interval and aligns them from time index 0 for direct overlays.
- Automate pass/fail. In CI, query NeoLoad Web V4 API (or a helper like neoloadcompare) to diffs vs. baseline on p90/p95/p99 and fail fast on regression.
- Correlate with APM. For any “red” interval, pivot to Dynatrace/Datadog/Prometheus views filtered by test tags and time window; confirm whether the bottleneck moved (CPU, GC, DB wait, network saturation) between ramps and plateaus.
- Close the loop. Feed learnings into your design: targeted monitors, refined SLAs, and (as Tricentis rolls it out) Augmented Design to auto‑correlate dynamic values and harden scripts earlier.
Common questions—answered quickly
1. Does Augmented Analysis replace expert review?
No—think of it as a force multiplier that highlights what’s interesting; experts still make the call.
2. Do I need to re‑train teams on a new UI?
Minimal. The next‑gen UI standardizes design with other Tricentis tools while preserving familiar layout; classic remains available.
3. Can I get all this by API?
Yes. The V4 API exposes significantly more than V3, including results, intervals, workspaces, roles, and reporting—built for automation.
Where this is heading
Tricentis is extending NeoLoad’s AI story beyond RED metrics: deeper project‑aware analysis, APM‑enriched triage, and Model Context Protocol (MCP) for conversational access to runs, comparisons, and reports—connecting performance intelligence across the Tricentis toolchain.
Key takeaways
- Start using intervals (manual + AI) to shrink time‑to‑insight on every run.
- Gate with SLAs that use percentiles and per‑interval thresholds; wire alerts.
- Automate the review with the V4 API and baseline diffs in CI/CD.
- Correlate early with APM/observability so you can explain why a red interval is red.
For a deeper walkthrough and live demo:
Watch: “Tricentis Expert Session: The NeoLoad AI Journey – Augmented Analysis” on Tricentis Academy.