


Do you have a question about NeoLoad? Join our upcoming NeoLoad Q&A session.
Introduction
Tricentis NeoLoad’s RealBrowser feature enables performance testers to execute load tests using real web browser instances. This approach captures true end-user experience metrics (like full page render times and Core Web Vitals) without the need for manually correlating dynamic parameters. However, leveraging RealBrowser effectively requires some advanced techniques and careful configurations. This article explores best practices for RealBrowser scripting, highlights common pitfalls, and provides strategies for optimal configuration and performance debugging. The goal is to help intermediate to advanced testers design robust browser-based load tests that accurately measure performance while avoiding common mistakes.
Keep it Performance-Focused (Not Functional Testing)
One of the first principles when using NeoLoad RealBrowser is to remember that it’s a performance testing tool, not a functional UI tester. RealBrowser scripts may resemble functional test scripts (with clicks and typed input), but you should avoid trying to validate every UI detail or link. Don’t treat RealBrowser like a functional automation tool – for example, you generally don’t care about verifying UI layout, fonts, or every hyperlink as you would in a functional test. Instead, focus on the critical user flows and page loads that matter for performance. Attempting comprehensive functional validation in NeoLoad is “like trying to swat a fly with a Buick”, as one expert quipped – technically possible but absolutely the wrong tool and too much effort. By keeping your RealBrowser scripts laser-focused on performance (e.g. how long pages take to load under load, or how the app responds to certain interactions), you ensure the tests remain efficient and maintainable.
In practice, this means using RealBrowser for end-to-end performance scenarios while leaving detailed UI correctness checks to functional testing tools. For example, you might have one RealBrowser script navigate through a purchase workflow to measure page load times, but you wouldn’t use it to verify that all images on the page have the correct resolution or that a dropdown menu expands on hover – those are functional concerns outside the scope of performance testing. Keeping this distinction clear will save you time and prevent frustration. It also aligns with NeoLoad’s design: RealBrowser collects timing data and simulates real user interactions, but it does not require you to manually handle things like dynamic session IDs (“correlation”) as protocol-level tests do. This lets you spend more time analyzing performance results and less time fiddling with script intricacies.
Efficient Scripting and Debugging Techniques
Getting your RealBrowser scripts right from the start will set the foundation for accurate and reusable performance tests. Here are several techniques to optimize your recording and debugging process:
-
Override Think Times for Debugging: It’s common during recording to inadvertently capture long “think times” (pauses) when you hesitate or plan your next step. NeoLoad might record these pauses as 30-second delays, which are not useful when you’re trying to debug the script flow. In the Post-recording Wizard, enable the option to override recorded think-times to a small value (or zero) for your initial script validation runs. This way, when you “Check User Path” (NeoLoad’s playback test), the script will run quickly through steps without lengthy idle times, allowing you to see what’s happening in real-time. Overriding think time is a great best practice for debugging purposes – otherwise, you might be stuck watching a browser sit idle for 35 seconds simply because you paused during recording. Once you have verified the script works correctly and flows as expected, you can restore realistic think times to simulate actual user wait periods before the full load test. In summary: speed up think times while debugging, then reinstate appropriate delays for load testing so that user pace is realistic.
-
Add Transactions and Capture Requests: Divide your user path into logical transactions (segments) during recording. NeoLoad’s recorder toolbar allows you to define transaction markers which label groups of actions (e.g. “Login”, “Search Product”, “Checkout”). In the post-recording settings, make sure to enable “add a capture request at the beginning of each transaction.” This feature inserts a special timing wrapper that captures all underlying HTTP requests for that transaction step. Using capture requests gives you much deeper insight during results analysis – NeoLoad will report how long each transaction took and even provide breakdowns of resource load times within those steps. In essence, a Capture Request acts like a container or bucket that times all network activity from the moment the transaction starts until it ends. This is invaluable for pinpointing which page or action is slowing down the user journey. For example, if a “Search Results” transaction suddenly takes much longer than usual, you can inspect its capture request details to see if a particular third-party script or image is the culprit. Modern versions of NeoLoad even allow automatically adding these capture requests for all transactions with one setting, so there’s little reason not to use them. By maximizing granularity with capture requests, you simulate the user experience more accurately and can spot performance issues easily from the results data.
-
Keep Browser Settings Consistent: NeoLoad RealBrowser launches an actual Chromium-based browser for each virtual user, and you have some control over the browser’s environment. One important setting is the browser resolution. By default, NeoLoad uses a 1920x1080 resolution for the browser window. You can change this if needed (for example, to simulate a smaller laptop screen or a mobile viewport), but it’s recommended to stick to a standard resolution across all your scripts unless you have a specific reason to vary it. Inconsistent or unnecessary resolution changes can introduce variability or complicate your test design without adding value in most cases. Only in cases of responsive web design testing – where the layout significantly changes at different screen sizes – might you run separate scripts at different resolutions, and even then it veers more into functional testing territory. In nearly all performance scenarios, using the default resolution uniformly is fine. Likewise, consider other settings: locale and time zone can be configured in the recorder if your application content depends on them (e.g. date displays), but otherwise default values are usually sufficient. The key is to avoid unintentional differences, you want each virtual browser to behave consistently.
Check the RealBrowser recorder options, including screen resolution (1920×1080 by default) and advanced settings like locale and whether to ignore HTTPS errors. Maintaining a consistent resolution and environment ensures that all virtual users render pages similarly, making results comparable. Only adjust these settings if your test scenario explicitly calls for it (such as simulating different geolocations or languages), and document any changes so the team understands the context. By keeping these parameters uniform, you eliminate one source of variability and can better trust the performance measurements.
-
Explicit Actions vs. Implicit Hovering: RealBrowser records user interactions like clicks, typing, and navigation. However, by default it does not automatically record purely visual events like mouse hovers (mouseover events). This is by design – simply moving the mouse around can trigger many UI scripts (hover effects, dropdowns opening) which usually aren’t relevant to performance testing. A common pitfall is expecting a hover-triggered menu or tooltip to appear during playback without an explicit action. If your test scenario needs to activate a menu that normally appears on hover, you have two options: (1) perform a click on the menu element instead of just hovering (as a real user might click if hover isn’t captured), or (2) use NeoLoad’s recorder toolbar to explicitly add a MouseOver action for the needed element. The first approach (clicking) is simpler and was even demonstrated by the expert in the webinar – for example, instead of relying on hovering over a “Products” menu, he clicked it to ensure the submenu opened and was recorded. The key takeaway is to make intentional interactions: every step you need in the test should be a clear mouse click, keystroke, or scripted action. Implicit UI behaviors that aren’t user-driven can be ignored or handled via explicit script steps. NeoLoad does support mouseover events if you specifically record them, but use that only when necessary. Similarly, note that scrolling is not recorded unless it’s part of an action (like selecting an item in a list). If you need to test an infinite scroll page or load additional content by scrolling, you might have to manually insert a Scroll action in the script design. Always review your recorded user path to ensure any required UI interaction (hover, scroll, drag-and-drop, etc.) is either captured or added, so the script will replay reliably.
-
Bypass Security Warnings: When recording in certain test environments, the browser may encounter HTTPS certificate warnings or Content-Security-Policy (CSP) restrictions (for instance, if using self-signed certificates or if the app blocks external script injection). NeoLoad provides an option to ignore HTTPS errors / bypass CSP policies during recording. Enabling this will automatically skip over those “Your connection is not private” or CSP blocking dialogs that might otherwise pop up in Chrome. This yields a cleaner recording experience and a script that doesn’t get stuck on security prompts. If your application under test is on a secured network or uses strict CSP, be sure to toggle these options. It saves time and ensures the recorded script contains the actual business steps, not the steps to accept a cert or bypass a warning. After recording, you should ideally install NeoLoad’s root certificate in your test browser or environment to trust its proxy, but the bypass options are great for the recording phase to avoid interruptions. Remember that these settings are there to help in non-production or testing environments; in a production-like environment with valid certificates, you might not need them. The bottom line is: use the tools NeoLoad provides (like “Ignore HTTPS errors” and “Bypass CSP”) to streamline recording in test environments, so your focus remains on the actual user interactions.
Handling Dynamic Content and Asynchronous Events
Modern web applications often update content dynamically using JavaScript (AJAX calls, single-page app frameworks, etc.) without performing full page navigations. This can pose a challenge for performance scripting: how do you ensure NeoLoad waits for and measures these asynchronous events accurately? RealBrowser actions by default rely on the browser’s “busy” indicator to know when an action is complete – for example, after a click that triggers a new page load, NeoLoad knows to wait until the page fully loads (network activity completes) before ending the transaction timer. However, if clicking a button triggers a background AJAX request and content update (with no full page reload), the browser might not show a loading spinner even though work is happening. Without guidance, the RealBrowser script could move on immediately, not waiting for the content to finish loading, leading to inaccurate timings or even failures (e.g. trying to interact with an element that hasn’t appeared yet).
Situation Example: The webinar demonstrated a page where clicking “Start” causes a message “Hello World” to appear after a few seconds. Initially, the recorded script clicked the button and then immediately ended the transaction, because from the browser’s perspective, there was no page navigation – just an async update. The result was that the script didn’t wait for “Hello World” to appear, and the reported time for that action was essentially zero (not reflecting the true user wait time). To fix this, we need the script to wait explicitly for the dynamic content.
Solution – Wait for Specific Elements or Conditions: NeoLoad provides a WaitForSelector action (also called “Wait for element”) precisely for this scenario. This action tells the virtual browser to pause until a certain element exists or reaches a certain state on the page. In our example, after the “Start” button click, we can insert a WaitForSelector targeting the text “Hello World” (or an element ID/container that will contain the message) and specify that we’re waiting for it to become visible. The script will then hold at that step until the condition is met (or a timeout is reached), ensuring that the subsequent actions and timing measurements include the dynamic load time. The RealBrowser recorder even allows adding such waits during recording: by toggling the “Wait” mode and right-clicking on the element of interest, you can capture a wait condition on the fly. If you didn’t do it while recording, you can always add a WaitForSelector in the design phase afterward.
When adding a WaitForSelector, you can choose to wait for an element to be visible, attached (present in DOM but not necessarily visible), hidden, or detached (removed from DOM). Typically, for content that should appear, you wait for it to be visible (which implicitly means it exists in DOM and is rendered). For something that should disappear (like a loading spinner), you might wait for it to be hidden or detached. You can also specify a maximum timeout (NeoLoad uses 10 seconds by default, but you can adjust per need). In our example, we set the wait for the “Hello World” text to visible, with a reasonable timeout in case something goes wrong. After implementing this, the script correctly waited ~3 seconds for the message to load, and the timing for that step now reflected the real user experience. NeoLoad even offers an automated way to insert standard waits: the 2023.2 release introduced a one-click “automated selector wait time” feature that adds appropriate waits so elements have time to appear. Whether you use the automation or add waits manually, the takeaway is: always account for asynchronous activity. If your application updates content without a full page refresh, make sure your script waits for those updates, or you risk misleading results.
In addition to WaitForSelector, RealBrowser allows other synchronizations. For instance, you could use waitForNavigation parameters on certain actions if a navigation is supposed to occur but isn’t automatically caught. These parameters (available on actions like Click or Navigate) let you specify to wait for a new URL, or wait until the network is idle, etc., before considering the action done. For example, if a click should trigger a route change in a single-page app that doesn’t cause a full reload, you might set waitForNavigation.until = NETWORKIDLE so NeoLoad knows to wait until network activity settles. This is an advanced tweak, and the built-in defaults usually handle most cases, but it’s good to know you can fine-tune what “done” means for a page load. A tip from the documentation: not all pages fire the traditional “load” or “DOMContentLoaded” events (especially single-page applications might load content dynamically later) – in such cases, using NETWORKIDLE or COMMIT as the completion criteria can be more reliable.
In summary:
Handling dynamic content in RealBrowser scripts boils down to:
-
Identify points in your user path where the application is doing background loading or updates (no obvious full page load).
-
Insert appropriate waits (for element appearance/disappearance or for network to go idle) after the triggering action.
-
Verify during test execution that those waits indeed capture the delay (use “Check User Path” to see if the script pauses correctly and continues when the content is ready).
-
By doing this, your timing measurements for those steps will be accurate, and your script will be more robust (no false failures because an element wasn’t ready). It aligns the automated test timing with what an actual user would experience waiting for the content to finish.
Ensuring Script Robustness and Maintainability
Beyond handling waits, there are additional techniques to make sure your RealBrowser scripts remain stable over time and easier to maintain as the application evolves:
-
Use Resilient Selectors: The RealBrowser recorder automatically captures CSS or XPath selectors for elements you interact with. By default, it may include element IDs if available, since those are unique and often reliable. However, many modern web apps generate dynamic element IDs that change every session or build. If you know your application has such dynamic IDs (for example, IDs that contain session tokens or incrementing numbers), it’s wise to disable the “Use IDs in recorded selectors” option before recording, or remove the ID from the selector in the script design. Instead, rely on more stable attributes like classes or even custom data attributes. In fact, it’s a good practice for developers to add test-friendly attributes (e.g.
data-testid="submit-button") to key elements. NeoLoad can be configured to prioritize custom attributes likedata-testidin its selectors, which can greatly increase script resilience. The more your element locators resist change, the less often you’ll need to update scripts when the UI changes. After recording, scan through the script’s element targets – if you see overly brittle selectors (like ones that contain auto-generated gibberish or long nth-child chains), consider editing them to something simpler and more robust. This might involve switching an XPath to a CSS selector that uses a class name, or adding an alternate selector. NeoLoad supports multiple selector expressions for one action (it can try one, and if it fails, fall back to another) as a way to increase resilience, which you might use if your app has slight variations in UI that require different selectors. In short, treat your RealBrowser scripts similar to test automation scripts: invest a bit of time to make the element locators solid and you’ll have far fewer playback issues. -
Incorporate Assertion Steps (Judiciously): While we emphasized not doing full functional testing, a small number of assertions or checks can be helpful to verify the application reached the expected state at key points. For example, after a login step, you might assert that a “Logout” link is present (ensuring the login succeeded). RealBrowser doesn’t have a separate “assert” action like functional tools, but you can use WaitForSelector with a short timeout purely as a check (e.g. wait for a welcome message to appear – if it doesn’t within, say, 5 seconds, that iteration likely failed). These kinds of validations, if used sparingly, can catch issues early in a test run and make it clear which step failed. They can also give additional data points (like “time to first meaningful element”). Just avoid overusing assertions to check minor UI details, as that goes back into functional territory. A couple of well-placed checks for critical functionality (search results returned, confirmation message shown, etc.) is usually enough.
-
Use the Post-Recording Wizard Features: NeoLoad’s Post-recording Wizard (which appears after you finish recording a RealBrowser script) has some useful options that improve script reliability. Always choose to “Redesign the user path to increase robustness”, which wraps your actions in a try-catch structure and appends a CloseBrowser action at the end. This ensures that even if an error occurs, the browser instance will close properly. It’s especially important when running many iterations or users – you don’t want orphan browser processes if a script hits an error. The redesign step might also implement some best practices automatically (future versions add auto-waits, etc., as noted). Additionally, if your recording included a login, the wizard can prompt you to parameterize credentials. Take advantage of that by supplying a variable or dummy login details, so the script is ready to log in on replay without manual intervention. Overall, the wizard is there to take care of common adjustments; don’t just skip it. A few clicks there can save you from common pitfalls like forgotten logouts or missing error handling.
-
Test Iteratively and Use “Record Here” for Updates: After initial recording and design, always run a single virtual user test (Check User Path) to validate the script. Watch it execute – NeoLoad will show a browser window for the user path when you run it in debug mode, so you can actually see if it navigates correctly and identify where it might be mis-clicking or typing wrong. If something doesn’t work, you can fix it by editing the script (adding waits, changing selectors as discussed). NeoLoad provides a “Record Here” feature that’s extremely handy for maintenance: you can pick a point in an existing script and re-record actions from there. This is useful if, say, a part of the flow changed due to an application update – you don’t need to record everything from scratch, just update the affected portion. The new steps will be inserted into your user path, which you can then adjust or merge as needed. Embrace an iterative approach: Record → Debug (playback and fix) → Tweak → Re-run, until the script is solid. Once it runs cleanly by itself with one user, you’re ready to use it for larger scale tests.
-
No Manual Correlation Needed: If you come from a protocol scripting background, you might wonder about handling dynamic values (session IDs, tokens, etc.). RealBrowser handles these automatically by virtue of running a real browser – cookies, tokens, and dynamic content are processed just like in a normal browser session. As the Tricentis experts point out, with RealBrowser “there’s no correlation, so you’re in good shape there.”. That means you typically do not need to search for and replace dynamic IDs in responses – the browser’s JavaScript engine and DOM will naturally carry those values. This is a huge productivity win. The only caveat is if you need to validate or extract some value for reporting, you might use an EvaluateJavaScript action to retrieve it from the page. But you won’t be doing the traditional regex-based correlation dance. Keep this advantage in mind and avoid over-complicating your RealBrowser scripts with protocol-level thinking – much of it isn’t necessary.
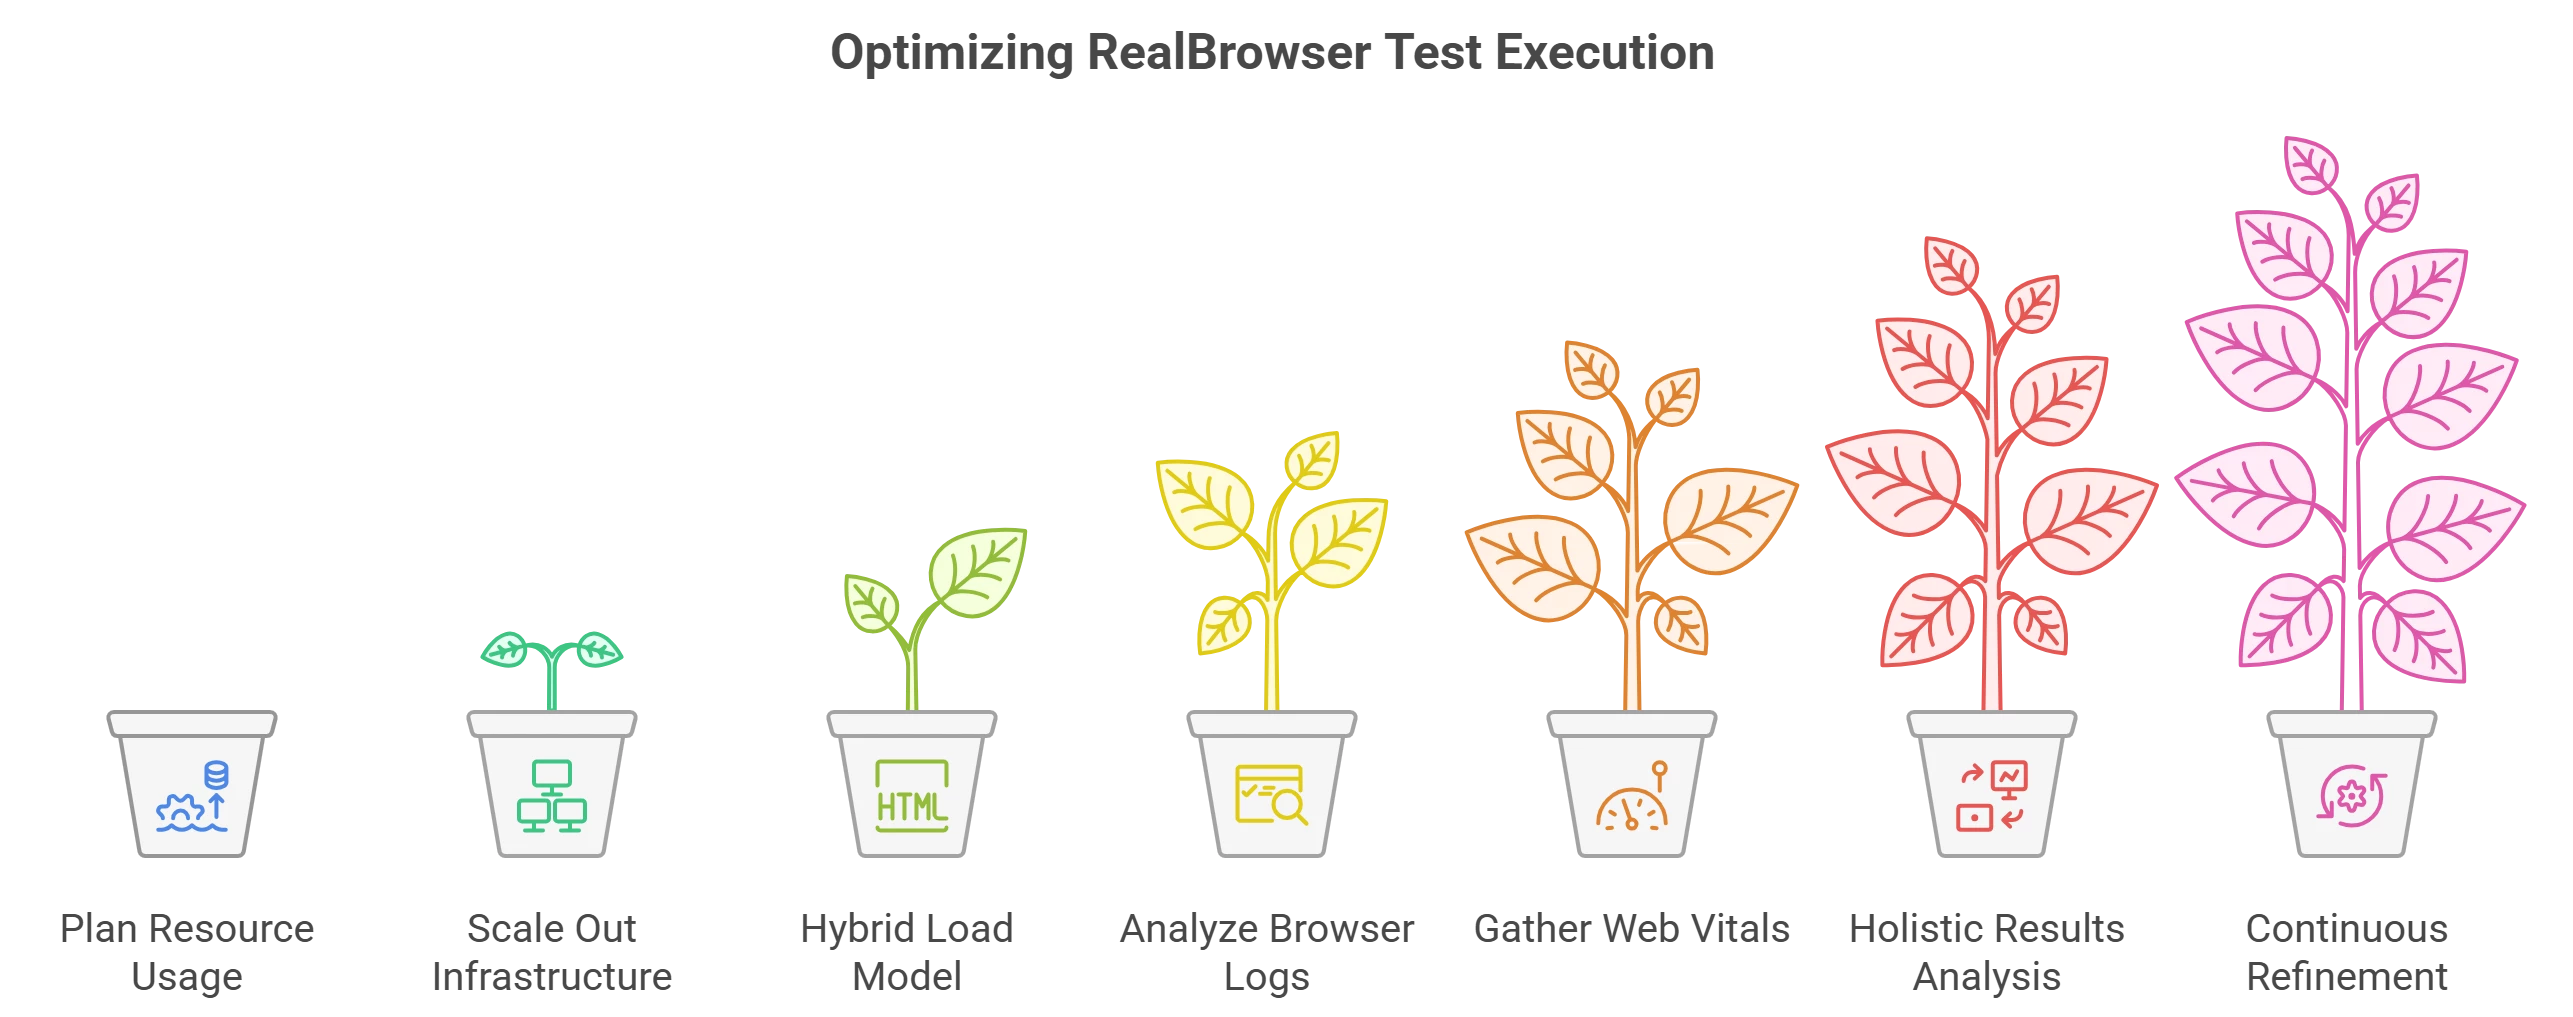
Optimizing Test Execution and Performance Debugging
After you’ve built robust RealBrowser scripts, the next considerations are how to run them at scale and how to interpret/debug performance results. RealBrowser tests can uncover client-side performance issues, but they also consume significantly more resources than protocol tests. Let’s break down the key points for execution and analysis:
-
Plan for Resource-Heavy Tests: Each RealBrowser virtual user actually launches a full browser instance under the hood. This is far more CPU and memory intensive than protocol-based virtual users that just send HTTP requests. The impact on your load generator machines can be substantial. Expect high CPU usage (the browser rendering JavaScript is CPU-intensive) and significant memory usage (loading heavy pages, images, etc., uses memory) on load generators. As one expert noted, if your app uses tons of JavaScript, the test will likely be CPU-bound; if it loads lots of big images, it might be memory-bound. Always monitor the infrastructure health during a run: check the CPU load and OS memory usage on each load generator. A good rule of thumb is to keep CPU below ~80% utilization to ensure stable timing. Unlike protocol tests, throwing too many RealBrowser VUs on one machine can skew results or even crash the load generator. NeoLoad documentation suggests tuning the load generator’s JVM to only about 15% of the host’s memory and leaving the rest for the browser processes, since the browsers (not the NeoLoad engine) consume most of the memory. Also note that increasing the load generator JVM heap won’t help the browser – the browser is a separate process, so focus on system RAM and CPU availability instead of just JVM tuning.
-
Scale Out, Not Just Up: Due to the heavy footprint, you will likely need to distribute RealBrowser users across many machines (or cloud instances). Don’t hesitate to scale out horizontally. For example, a major retailer was cited to run 10,000 RealBrowser users by utilizing ~200 load generator instances. That’s an extreme case, but it shows that high-scale RealBrowser testing is possible with proper infrastructure – in their case using cloud auto-provisioning to spin up generators on demand. Leverage NeoLoad’s cloud integration or your own virtualized environments to get the necessary firepower for large tests. Start with smaller pilot runs to gauge how many users per machine can run comfortably for your application. Maybe you find that one 8-core machine can handle 50 concurrent RealBrowser VUs for your app before CPU hits 80%. Use that to estimate how many machines you need for the target load. NeoLoad’s Dynamic Infrastructure feature can help automate this, provisioning the exact number of load generator instances needed and tearing them down after the test. This not only ensures your test runs reliably, but it can also save cost by not running oversized servers continuously. Keep in mind there’s effectively no hard coded limit in NeoLoad for RealBrowser user count besides what your hardware can support – Tricentis has not found an upper limit before other factors intervene, even tests up to 1 million virtual users (likely with protocol mix) have been mentioned. Practically, your limit will be budget and infrastructure.
-
Consider a Hybrid Load Model: An excellent strategy for balancing realism with resource consumption is to combine protocol-level and RealBrowser-level users in the same test scenario. RealBrowser users are great for capturing client-side metrics and validating end-user flows, but you might not need hundreds of them to generate the desired load. Protocol users (HTTP) are very efficient at simulating load on the backend with low overhead. NeoLoad supports running both types simultaneously. For example, in a test for 5,000 users, you might run 4,500 as protocol API users and 500 as RealBrowser users. The protocol users will stress the server endpoints, while the RealBrowser users will give you data on how the UI performs (page render times, etc.) under that load. This hybrid approach is explicitly suggested by Tricentis – it allows end-to-end metrics while maximizing your hardware use by not requiring a browser for every single virtual user. You get the best of both worlds: scale and depth of insight. When designing such tests, ensure the RealBrowser users cover the critical journeys (maybe 10% of users do the full UI workflow), whereas the protocol users can simulate the rest of the traffic. This also helps in performance debugging: if overall response times degrade under load, your RealBrowser users will show how that translates to user experience (perhaps increased LCP or slower JS execution), and you can correlate that with server metrics from the protocol side. Many teams find this approach yields comprehensive results without breaking the bank on infrastructure.
-
Leverage Built-in Browser Logs and Screenshots: NeoLoad captures some helpful artifacts for RealBrowser tests. Each RealBrowser virtual user can take screenshots of the pages (by default, a screenshot is captured at the end of each page during recording, and you can enable or disable this). These screenshots are mainly for reference during scripting (they show what was recorded), but NeoLoad also has a runtime browser log (browsers.log) that aggregates console output and error messages from the browser. If a RealBrowser action fails (say a click didn’t find the target, or a JavaScript error occurred), this log can be extremely informative. It might show a stack trace or a console error from the web app that helps identify the problem. You can access this log through NeoLoad’s interface (Help > Open logs folder) and inspect
browsers.logfor any suspicious output during the test run. Additionally, if a validation fails or a script error happens, NeoLoad will mark the user path as failed and usually indicate which step. Use these clues to debug – maybe the application changed and an element wasn’t found (requiring a script update), or perhaps the application itself threw an error under load (which is a performance defect to investigate). In complex scenarios, you can also run a single RealBrowser user locally with dev tools open to profile front-end performance if needed. But even without doing that, the combination of capture request data, browser logs, and NeoLoad’s own result metrics should allow you to pinpoint performance bottlenecks. -
Gather Client-Side Performance Metrics (Core Web Vitals): One of the major benefits of using RealBrowser is the ability to capture front-end performance indicators that pure protocol tests miss. NeoLoad can measure Core Web Vitals and other user-centric metrics during RealBrowser tests. Core Web Vitals are a set of metrics defined by Google that include Largest Contentful Paint (LCP) – how quickly the main content of the page loads, Interaction to Next Paint (INP) – how responsive the page is to user input, and Cumulative Layout Shift (CLS) – how stable the layout is (does it shift around) during loading. These are crucial for understanding real user experience. NeoLoad’s RealBrowser can capture these metrics at runtime by inserting a special action or via a setting. In NeoLoad 2025.3, for instance, you can add a “Capture Core Web Vitals” action at the beginning of a transaction (or enable it in the post-recording wizard) to automatically collect LCP, INP, and CLS for that page. This is highly valuable for performance debugging: if your server response times seem fine but users still report slowness, metrics like LCP or INP might reveal front-end bottlenecks (e.g., large images or heavy client-side processing). By reviewing these in the NeoLoad results, you might discover that, say, the Largest Contentful Paint on the homepage is 4 seconds, largely due to a huge banner image – insight that can drive front-end optimization efforts. Enabling Core Web Vitals in your RealBrowser tests thus gives a more complete picture of performance. It’s essentially like running a Lighthouse audit in a load test scenario. Be aware that as of 2025, analyzing these metrics requires using the NeoLoad Controller (not NeoLoad Web SaaS), but that’s a minor inconvenience compared to the benefits. Whenever possible, incorporate such client-side metrics into your testing regimen. They provide tangible, user-focused data that complements traditional metrics like throughput and response time, and they speak directly to user experience improvements.
-
Analyze Results Holistically: When your test finishes, take advantage of NeoLoad’s results analysis features. With RealBrowser, you’ll have additional data points: each transaction (if you used capture requests) will have a breakdown of resource load times, and possibly Web Vitals metrics if enabled. Look at the timeline of a page load – which resources took the longest? Did any third-party calls (ads, analytics, etc.) stall the rendering? The capture request container will list all requests made during the transaction; you can sort by duration to find slow ones. Also, correlate the client-side timings with server-side metrics. If you have APM tools (like Dynatrace or AppDynamics) integrated, see how backend traces align with the slowdowns observed on the client. The goal in performance debugging is to identify where the time is being spent. RealBrowser gives you the client perspective: maybe the server responded in 1s, but the page still took 4s to fully display content because of client-side processing – now you know to investigate the front-end code. Another example: you might observe that under heavy load, error rates increase or certain steps start failing (perhaps a WaitForSelector timed out because content never appeared). This could indicate the application is struggling (e.g., an API call never returned, so the UI spinner never went away). Such failures themselves are valuable data: they highlight bottlenecks or capacity issues. Document all these findings as you would in any load test report, but with the richer context RealBrowser provides. Sometimes just showing a graph of page load time vs. number of users (from the RealBrowser data) can make it very clear at what point the user experience degrades.
-
Continuous Refinement: After analyzing results, you may decide to tweak the test or script and rerun. Maybe you realized a certain user path wasn’t covered, or you want to try a higher load now that you’ve tuned infrastructure. RealBrowser scripts might need updates if the app changed or if you found a more efficient way to do something (for example, perhaps adding an extra wait for a minor element that occasionally was slow, to avoid a rare failure). Keep the scripts up to date and version-controlled if possible. As your application evolves, periodically re-run the RealBrowser scripts (even at low load) to ensure they still work – this prevents last-minute surprises before a big test.
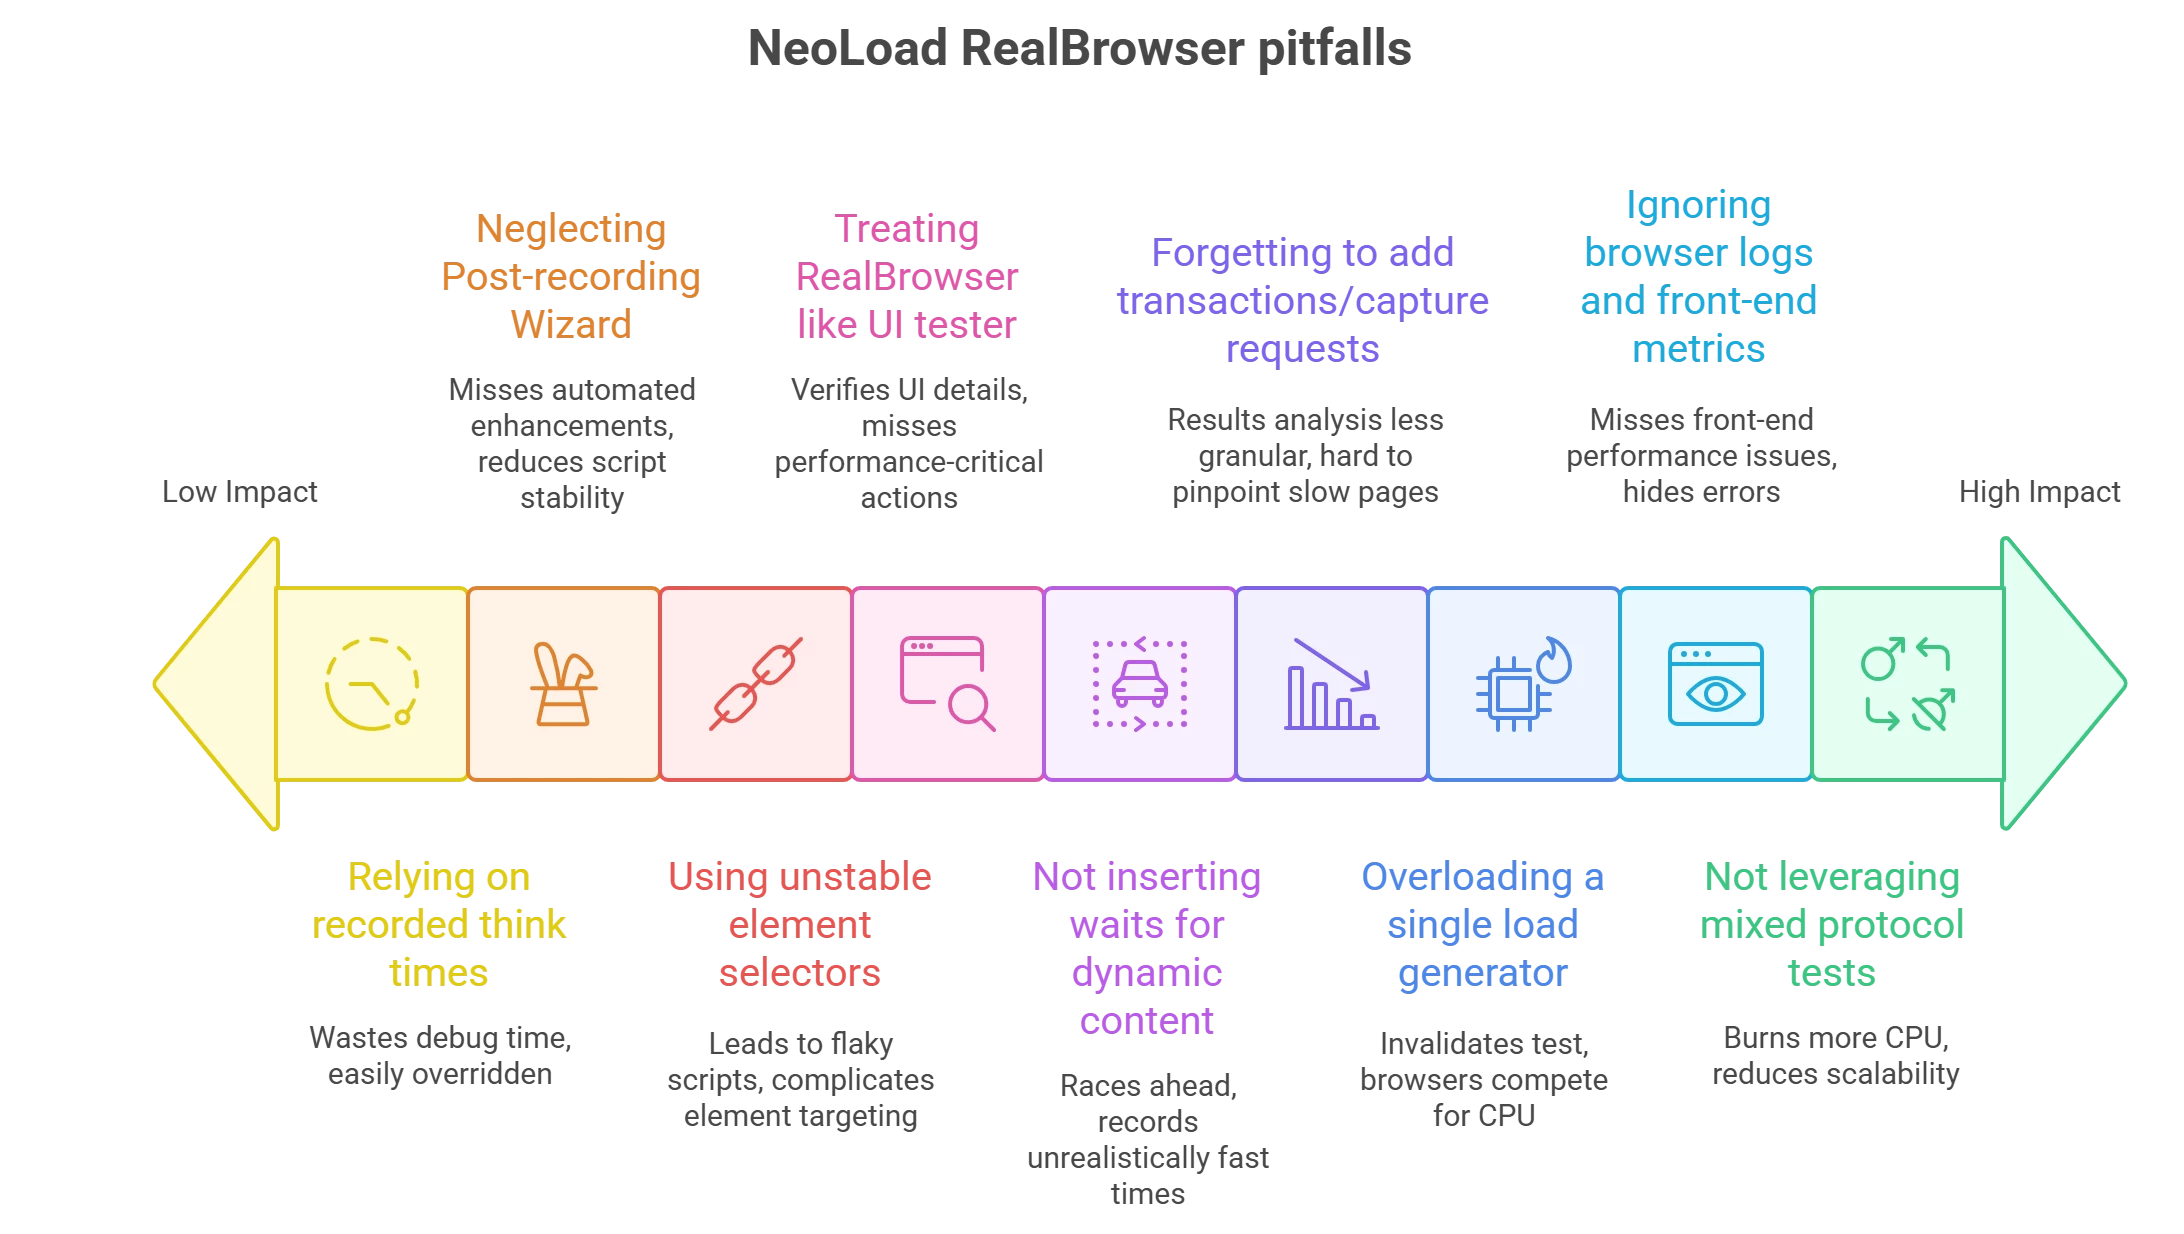
Common Pitfalls to Avoid
To recap, here are some common pitfalls when using NeoLoad RealBrowser and how to avoid them:
-
Treating RealBrowser like a UI tester: Don’t attempt to verify every UI detail or use it for full functional testing – stay focused on performance-critical actions. Use functional test tools for UI validation, RealBrowser for performance timing.
-
Not inserting waits for dynamic content: If your script doesn’t explicitly wait for AJAX-loaded elements, it may race ahead and record unrealistically fast times or fail. Always add WaitForSelector or similar waits for content that loads asynchronously.
-
Relying on recorded think times during debugging: Long pauses in recorded scripts can waste your debug time. Override or shorten think times when testing scripts, so you can quickly see each step execute. You can restore proper think times for the actual load test.
-
Forgetting to add transactions/capture requests: Without logical transactions and capture request containers, your results analysis will be less granular. It’s harder to pinpoint slow pages if everything is one big flow. Mark transactions and use capture requests to get per-page timings.
-
Using unstable element selectors: Accepting whatever selector the recorder chose can lead to flaky scripts if those selectors are brittle. Check for dynamic IDs or overly complex XPaths. Simplify selectors or use custom attributes to make element targeting robust.
-
Overloading a single load generator: Trying to run too many RealBrowser users on insufficient hardware can invalidate your test (browsers will compete for CPU, skewing timings). Monitor resources and distribute load across more machines or cloud instances to maintain realistic conditions.
-
Neglecting the Post-recording Wizard: Skipping the wizard means you might miss out on automated enhancements like adding error handling (try-catch) and CloseBrowser actions. These help prevent browser instances from piling up and improve script stability.
-
Not leveraging mixed protocol tests: If you only use RealBrowser for every virtual user when you have the option to mix in protocol users, you might be burning more CPU than necessary. Consider a blend of protocol and RealBrowser users for large-scale tests. This provides scalability while still capturing client-side metrics.
-
Ignoring browser logs and front-end metrics: When things go wrong, don’t just look at server-side data. Check NeoLoad’s browser logs for errors, and examine metrics like LCP or other Web Vitals to understand the front-end performance. They might reveal issues hidden from typical response time graphs.
By being mindful of these pitfalls, you’ll avoid the common “gotchas” that can hamper RealBrowser testing efforts.
Conclusion and Next Steps
Tricentis NeoLoad’s RealBrowser opens up powerful possibilities for performance testing by incorporating real browser interactions and measurements. By applying the advanced techniques discussed – from overriding think times and using capture requests, to synchronizing dynamic content with waits and tuning your test infrastructure – you can achieve a high level of realism and accuracy in your load tests. Remember to design your scripts for maintainability and focus on the user experience metrics that matter. Performance testing with RealBrowser is a blend of art and science: you simulate real user behaviors with the art of scripting, and you diagnose performance issues with the science of measurements and analysis.
With these best practices in hand, you’ll be better equipped to create effective RealBrowser tests that provide deep insights into your application’s performance. As always, performance engineering is an iterative process – keep refining your approach as you learn from each test run. Your final goal is to ensure that when real users interact with your application under load, they encounter fast, smooth, and error-free experiences.
For a deeper dive and live demonstration of these concepts, you can watch the full webinar titled “Tricentis Expert Session: Advanced Techniques for Leveraging Tricentis NeoLoad RealBrowser” on the Tricentis Academy site. It offers an expert walkthrough of RealBrowser capabilities and troubleshooting in action. Check out the webinar and take your NeoLoad RealBrowser skills to the next level!