


Each performance testing activity is mapped out in the following workflow:
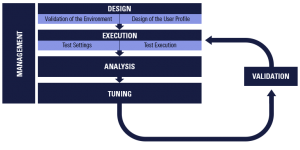
Performance test objectives will need to adapt depending on results. The performance engineer will analyze these results between testing and tuning. Ultimately, the main objectives of a performance test are to identify bottlenecks and offer solutions. Below are the three key steps in executing an effective performance test.
Performance test design
Historically, the design phase has been referred to as “scripting,” but new technology has made this phase much more complex today.
Creating performance testing scripts is essentially a software development project. Sometimes, automatic script generation from the recording is mistakenly interpreted as the “whole” process of script creation, but it is only the beginning. Only in limited select cases will automatic generation provide completed scripts. In most non-trivial cases, it’s just a first step. Scripts need to be correlated (procuring dynamic variables from the server) and parameterized (utilizing different data for different users). These operations are prone to errors because changes are made directly to the communication stream. Any mistakes at this point can be very dangerous because these types of mistakes usually cannot happen in the real world where the users interact with the system through a user interface or API calls.
AJAX applications, WebSocket, and polling technologies generate regular requests. These requests are not generated by the interaction of the user within the graphical user interface. Instead, many calls are generated by one or more individual page components. For example, on an eCommerce website, there is always a direct link to the user cart from the pages. This link needs to show the user the exact number of products currently in his or her basket. Most of the time, the number of products is displayed via a polling request (a technical call performed every five seconds). This type of call needs to be understood by the performance engineer. All “polling” mechanisms would need to be removed from the business step of the user journey and placed into a dedicated thread.
Another good example is adaptive streaming technology. Many testers often rely on the record/playback approach. Unfortunately, this type of logic won’t benefit any testing strategy. The goal is to qualify the behavior of the application under realistic load, not to validate the caching. Replaying back the recording request with no correlation will only call the cache of the application: web and application cache.
An additional important element of the design step is the dataset. Using a small set of data will generate the same query on the database. As previously mentioned, the point of a load test is not to qualify the efficiency of the database cache or simply generate deadlocks.
After the script is created, it should be evaluated for both single and multiple users, and with different data. Do not assume that the system works correctly when a script is executed without error. Instead, ensure that the applied workload is doing what it is supposed to and catching/logging all errors found. It can be done directly by analyzing server responses or, in cases when this is impossible, indirectly. It can also be done by analyzing the application log or database for the existence of particular entries.
Many tools provide some way to verify workload and check errors, but a complete understanding of exactly what’s happening is necessary. Tricentis NeoLoad allows the user to create assertions to make sure that the response of the server is “normal,” (e.g., the content is as expected). For example, receiving “out of memory” errors in a browser page instead of the requested reports would qualify as unexpected content. It is important to catch such content errors with the help of assertions.
NeoLoad and many load testing solutions will automatically capture HTTP errors for web scripts (e.g., 500 “Internal Server Error”). If only the default diagnostics are relied upon, it can’t be verified that the business transactions are doing what is expected.
New web design tends to avoid HTTP errors and displays exception errors in the applications. So if checking is limited to examining only the HTTP codes, it can’t be determined if the scenario is achieving the expected actions on the application.
Performance test execution
When executing the actual test, take these challenges into consideration:
- Load testing architecture
- Effective test monitoring
Load testing architecture
The main objective is to load test the application, not the load testing software. Most load testing solutions have several components:
- Controller: Orchestrates the test, stores the results data: response time, hit(s), throughput, monitoring metrics, errors, etc.
- Load generator: Runs the load testing script against the application. This component will need to handle several hundreds of concurrent virtual users.
To avoid being limited by the load testing architecture, there need to be enough:
- Load generators to achieve the expected load
- Network bandwidth between the load generator and the application. Sizing load generators is a crucial step in defining the number of virtual users (VUs) that a load generator can handle. This number of VUs depends on many aspects:
- Technologies and complexity associated with the application to test
- Network connection capacity
Starting a “ramp-up” (or “scalability”) test of the application with one single load generator will help determine the maximum capacity of one machine. After determining the number of VUs a single load generator can handle (and the number of test VUs), it is easy to calculate the number of generators necessary to run the test. To pinpoint the load generator’s load limits, it requires that you keep an eye on its behavior under ramp-up test load, specifically:
- CPU
- Memory
- Throughput
- Hit rate
- Virtual users load
The first significant breaking point in the CPU, memory, throughput, and/or hit rate metrics represent the performance limit of the load generator. This point must be correlated with the number of VUs generated. Serious issues may occur with the load generators if pushed beyond this number of virtual users.
A 20-30% security margin out of the sizing limits is recommended for the load generators in a heavy load test. It is also important to avoid using the controller machine as a load generator. The controller is the heart of the test. It is always better to lose a load generator than a controller (the whole test result).
Effective test monitoring
There is limited time to run different tests to then proceed to monitor. Time shouldn’t be wasted by looking at the test data while the test is running. If response time starts increasing due to web server saturation, stop the test and start tuning the web server. Almost every time testing is started on a new application and/or environment, most of the layers (app/web server) are not configured or tuned for the load of the application. This means that every test on a representative environment needs attention from the performance engineer to properly tune the environment.
Every new test utilizing a new dataset also needs attention. For example, stop the test if every test user is generating errors when it logs into the application. On the other hand, if there is a good understanding of the application and the environment, test automation can be started without concern over application behavior. Once the test is finished, analyze the results.
Test analysis
Analyzing load testing results can be a job unto itself. Comprehensive knowledge of the following is required:
- Load testing design
- Technical layers involved in the application
- Modern architecture
Although this post doesn’t delve into results analysis how-to, here are some recommendations for reporting on the project’s performance testing results.
Almost all load testing solutions allow for the creation of complex graphs that correlate data. The performance engineer’s first inclination will be to show all of the graphs in the report.
Before creating this report, it is important to understand the role and the technical skills of the person validating or reading the report.
Based on these qualities, different types of reports can be created. For example:
- A technical report for developers and operations showing only important graphs
- A decision maker report giving a very simple status of the application’s performance
The main purpose of the performance testing report is to give a clear status on application performance. Result reports should be simplified, focusing on these three main themes:
- Response times
- Availability
- Scalability
A graphical presentation (e.g., three pie charts) makes the results easier to understand for the decision makers.
Ultimately, the performance report needs to highlight if the performance requirements (identified during the performance strategy phase) are validated.
Next steps
This is the final article in a four-part series focused on practical guidance for modern performance testing:
Part 1 – A practical introduction to performance testing
Part 2 – Establishing a performance testing strategy
Part 3 – Modeling performance tests
Part 4 – Executing performance tests
