The challenge of software testing is immensely underestimated and invariably unappreciated. Even with seemingly basic applications—like a common mobile app—there’s a staggering amount of testing approaches you could take, paths and conditions you could exercise, device configurations you could test against, and so on. With today’s near-continuous release cycles, ensuring that each update adds value without disrupting the user experience is already a daunting task.
The difficulty is exacerbated for enterprise organizations. At this level, testing must accommodate:
- Complex application stacks that involve an average of 900 applications. Single transactions touch an average of 82 different technologies ranging from mainframes and legacy custom apps to microservices and cloud-native apps.
- Deeply-entrenched manual testing processes that were designed for waterfall delivery cadences and outsourced testing—not Agile, DevOps, and the drive towards “continuous everything.”
- Demands for extreme reliability. Per IDC, an hour of downtime in enterprise environments can cost from $500K to $1M. “Move fast and break things” is not an option in many industries.
Particularly at the enterprise level, testing is the #1 source of delivery delays, manual testing remains pervasive (only 15% is automated), and testing costs consume an average of 23-35% of the overall IT spend.
Yet, many top organizations find a way to break through these barriers. They transform testing into a catalyst for their digital transformation initiatives—accelerating delivery and also unlocking budget for innovation.
What are they doing differently? And how does your organization compare?
Introducing the first annual enterprise application testing benchmark
To shed light on how industry leaders test the software that their business (and the world) relies on, Tricentis is releasing our findings on how the world’s top organizations test in the first annual How the World’s Top Organizations Test report. This data was collected through one-on-one interviews with senior quality managers and IT leaders representing multiple teams. The participants represented teams using a variety of QA-focused functional test automation tools (open source, Tricentis, and other commercial tools). Developer testing and security testing activities were out of scope.
The current report focuses on the data collected from the top 100 organizations we interviewed: Fortune 500 (or global equivalent) and major government entities across the Americas, Europe, and Asia-Pacific. All for-profit companies have revenue of $5B USD or greater.
We’re protecting everyone’s privacy here, but just imagine the companies you interact with as you drive, work, shop, eat and drink, manage your finances…and take some well-deserved vacations after all of that. Given the average team size and number of teams represented, we estimate that this report represents the activities of tens of thousands of individual testers at these leading organizations.
Key takeaways
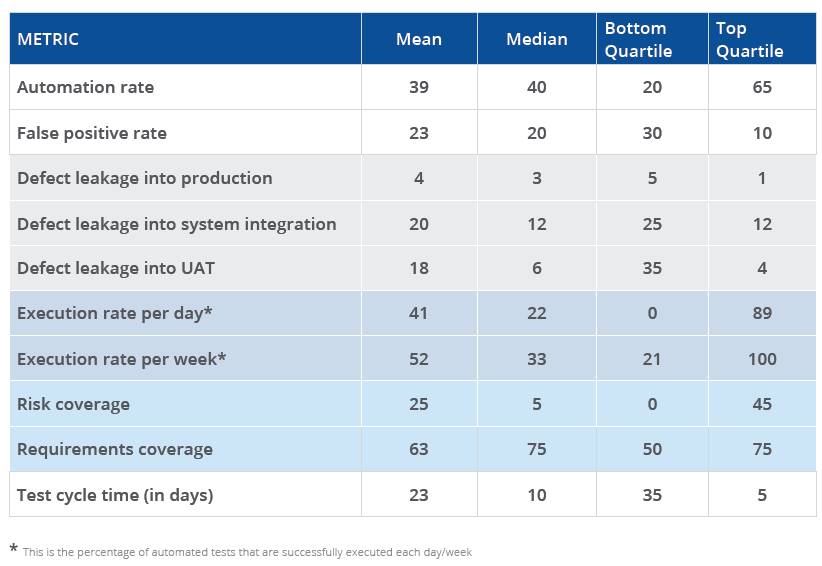
At a super high level, the results from these top organizations revealed 39% test automation… but high false positives, low risk coverage, and shockingly slow testing cycles. Here are some specific takeaways.
Automation without stabilization
The average test automation rate (39%) is relatively high, but so are false positives (22%). This is common for early-stage test automation efforts that lack stabilizing practices like test data management and service virtualization.
Tests aren’t aligned to risks
Requirements coverage (63%) is high, but risk coverage is low (25%). Likely, teams are dedicating the same level of testing resources to each requirement rather than focusing their efforts on the functionality that’s most critical to the business.
Dev and test cycles are out of sync
The average test cycle time (23 days) is shockingly ill-suited for today’s fast-paced development cycles (87% of which were 2 weeks or less back in 2018).* With such lengthy test cycles, testing inevitably lags behind development.
Quality is high (among some)
The reported defect leakage rate (3.75%) is quite impressive.** However, only about 10% of respondents tracked defect leakage, so the overall rate is likely higher. The organizations tracking this metric tend to be those with more mature processes.
Great foundation
Organizations have made good strides mastering the foundational elements of testing success (adopting appropriate roles, establishing test environments, fostering a collaborative culture).
“Continuous everything” isn’t happening…yet
Few are achieving >75% test automation rates or adopting stabilizing practices like service virtualization and test data management. Given that, limited CI/CD integration isn’t surprising. All are high on organizations’ priority lists though.
Greatest gaps
The greatest gaps between leaders and laggards are in the areas of the percentage of automated tests executed each day, risk coverage, defect leakage into UAT, and test cycle time.
Top improvement targets
The areas where organizations hope to make the greatest short-term improvements (within 6 months) are risk coverage, defect leakage into UAT, false positive rate, and test cycle time.
About the report
The complete 18-page benchmark report is available now. It covers:
- How leaders and laggards differ on key software testing and quality metrics
- Where most organizations stand in terms of CI/CD integration, test environment strategy, and other key process elements
- What test design, automation, management, and reporting approaches are trending now
- Organizations’ top priorities for improving their testing in 2021
Here’s a teaser of some of the data points you’ll find:

Over the course of 2021, we’ll continue sharing different analyses of our data set. Expect to see reports on trends:
- By industry
- By technology under test
- By region
- And interesting correlations across metrics, practices, and delivery methods
Footnotes:
**Typically, < 10% is considered acceptable, <5% is good, and <1% is exceptional


