This article is the third in a multi-part series on how to establish performance engineering practices that produce actionable performance analysis from automated pipelines.
Part 1: Continuous load testing using Jenkins pipelines and Kubernetes
Part 2: 3 Killer anti-patterns in continuous performance testing
Part 3: Accelerating performance analysis with trends and open API data
Key takeaways from Parts 1 and 2:
- Once performance test automation is reliable, it produces a critical longitudinal view.
- Open API-based performance data improves human and pipeline-based workflows.
- Performance data must be easily consumable and domain-specific.
Distributed systems are painful
The immediacy of feedback plays a crucial role in behavioral psychology. In her 1984 book, Don’t Shoot the Dog, Karen Pryor elaborates on how valuable positive feedback can be when applied sooner rather than later. Conversely, delayed feedback is often ineffective at improving situations and can easily have unanticipated out-of-context adverse effects.
Similarly, software teams building distributed systems suffer from “signal delay” in terms of feedback loops about complex behaviors of the software and infrastructure they deploy. Often non-functional (or, what I now call “holistic”) requirements are ignored due to:
- Pressing demands for higher velocity
- Cost and time to create and maintain environments suitable for verifying these requirements
- A general lack of expertise
One psychological specter remains feeding teams the doubt and justifications for ignoring what they will ultimately face: delayed pain. A cloud-based microservices example — late-stage performance engineering. Leaving performance criteria out of planning processes and running big-bang load tests only at the end of a project leave teams in a world of hurt. Non-trivial issues like cross-zone latencies, misconfigured timeouts and circuit breaker configuration, payload bloat due to nonoptimal queries, and poorly understood storage subsystems regularly leave development/operations teams scrambling to fix architectural issues.
Bring the pain forward
In many of our field experiences, customers who suffer less from these types of painful situations internalize the importance of making performance engineering a part of their team culture. Be it through dedicated expertise available to product groups, shrinking batch sizes (so fault isolation is easier in continuous delivery), or breaking up traditional monolithic notions of testing into activities matching clock speeds between development/release cycles, one common theme exists: automate what can be automated and verify frequently.
For modern performance engineering, the goal is to produce a regular stream of information relative to how the systems perform so that when performance degrades unexpectedly, it is identified and resolved quickly. This often means load testing at various volumes in multiple environments using continuous integration orchestrators like Jenkins, Gitlab, or CircleCI. The choice of what tests to run depends on risk factors in the system under test (SUT), time requirements of test design/execution, and code and environment configuration change frequency.
Sometimes automating performance testing isn’t straightforward, especially if it’s your first time. Tricentis NeoLoad works with organizations of all sizes and savviness. Despite every organization having different objectives and appetites for where fast feedback loops are applied, common outcomes include observability improvement through real-time performance testing results and historical trending.
Once performance automation is reliable and easy to pay attention to, teams feel more comfortable expanding performance results into automated go/no-go decision processes to reduce unnecessary manual effort further. Having bigger-picture freedom regarding how systems perform over time and how performance criteria are met across a portfolio of projects helps dissolves late-cycle pain, reinforcing the value of early and often performance validation.
Example: Longitudinal view of API performance
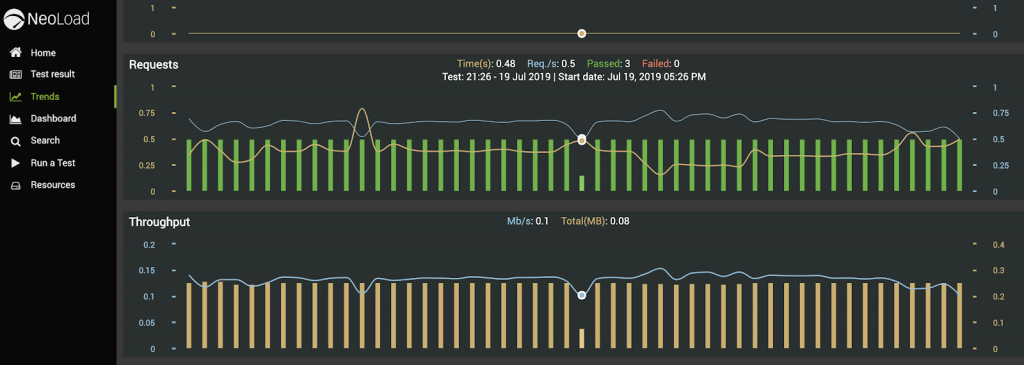
As an API team evolves project code to add endpoints, adjust existing backend queries, and change deployment configurations, low-level load tests in non-production-like environments provide early warning indicators when performance doesn’t meet SLAs. Key data points for API performance testing are:
- Overall test pass/fail
- Request-per-second (RPS)
- Throughput (Mbps)
- SLA failures
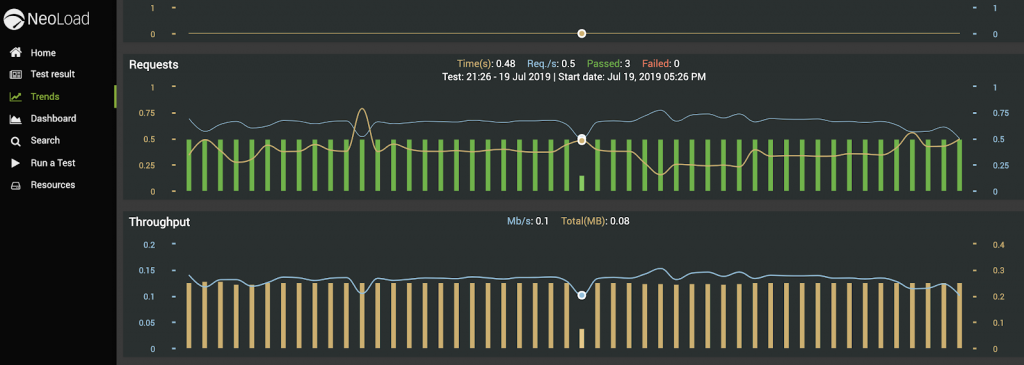
See below for an example of this in NeoLoad Web, which displays results of nightly load testing where critical API endpoints and workflows provide an easily accessible view of performance over time:
Additionally, each of these test results has specific SLAs, further clarifying what meets vs. falls short of expectations.
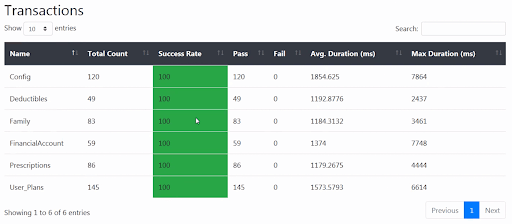
Importantly, all this data is available via a RESTful API with NeoLoad Web. Secure and open access to system data are critical capabilities of any product that works well within the modern IT landscape. Beyond information transparency, open APIs allow teams to optimize how their processes work within a safety net of standard interfaces.
Whether deploying this yourself or using our SaaS-based hosted version, your performance testing data can be aggregated and consolidated into whatever particular details you need to begin to build an automated go/no-go decision process suitable for your continuous pipelines. NeoLoad results boil down to a few common structures:
Improving pipeline throughput with automated performance go/no-go
Automated pipelines lacking stages for minimum-viable verification and validation checks don’t tell the whole story. They look green but leave critical details of reliable software delivery to be dealt with far later in production when it’s near impossible to trace back to contributing factors.
If you can’t fit something into a pipeline, it’s an excellent opportunity to ask, “Why doesn’t this fit?” Not everything imaginable can be automated, but that’s no excuse not to try hard. What is automated will minimize the toil. If it proves incredibly difficult, try a few approaches, document the process, automate as much as possible, and come back with fresh ideas later. When you begin to fit performance testing into an automated pipeline, you learn:
- Which areas of your apps/services have obvious and repeatable errors
- Which tests are worth running (providing value) and those which are not
- Which systems are unnecessarily complicated and cause anti-patterns and flakiness
- Which supportive environments (including data) are unstable/unreliable
- Which contributors demonstrate critical thinking vs. writing more code
Case study: Pipeline-based automated go/no-go for DevOps customers
We worked with Panera Bread’s performance and automation teams to build a custom go/no-go process in Jenkins pipelines that worked with their particular requirements, some of which included:
- The production of a human-readable, archivable performance comparison report that highlighted percentile variations beyond predetermined ranges (+/- 5 or 10 percent) for:
- Specific test workflow transactions (i.e., Login, Add to Cart, Checkout, etc.)
- System indicators (JVM garbage collection counts, thread pool sizes, etc.)
- Specific API requests
- The output of a list of violations based on the above constraints in a format easily consumable by Jenkins
- JSON comparison data that indicated go/no-go if any violations exist
- Custom range and violation rules are written in Node.js (for skills ubiquity sake)
- A process pattern for persisting particular test results for a project as the baseline for future job runs (until a new benchmark on that project is established)
The goal of this work was to enable product teams to easily add performance testing as a high-level requirement using an automation flag, then based on Groovy libraries/naming conventions, run existing performance tests regularly, and automatically manage baselines used in continuous comparisons to highlight unexpected performance changes in frequent CI builds.
The generic code for the comparison report is on Github. However, it highlights only an example of what you can do with a proper enterprise performance testing platform that is transparent and built with extensibility in mind. Since Panera also had custom rules for maintaining and automatically rolling over successful tests as the new baseline under specific conditions, we came up with a primary sequence for the process:
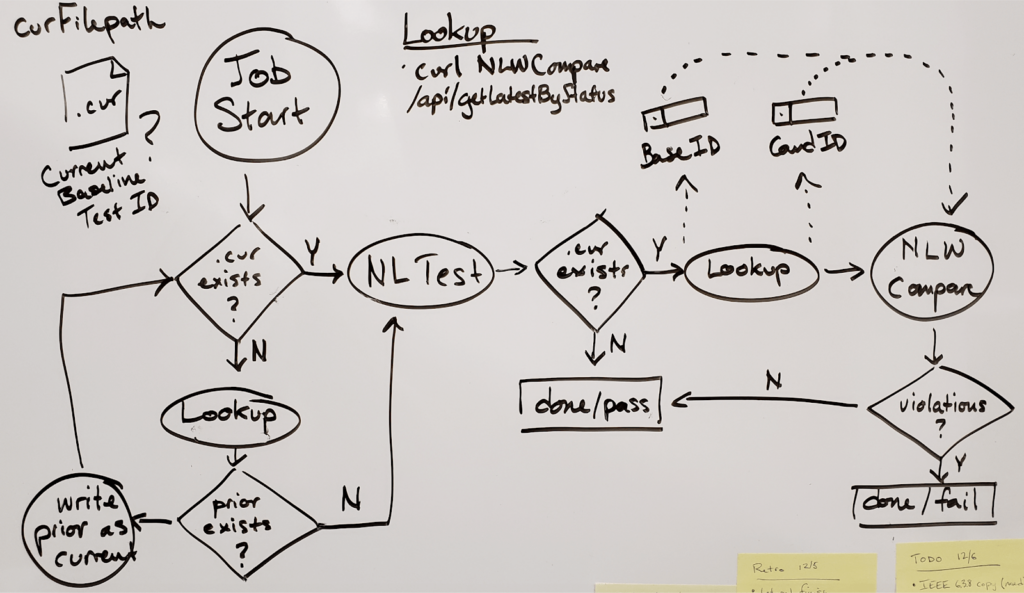
With this simple mechanism, they were able to build standard Jenkins shared libraries to simplify logistics in individual project pipeline scripts. Ultimately, they rolled up all performance semantics to a single project opt-in flag. Leveraging Tricentis NeoLoad test suites in a project subdirectory, these pipelines ran various load tests compared to baseline (using any out-of-bounds variances and violations to stop the deployment process, signaling engineers to investigate).
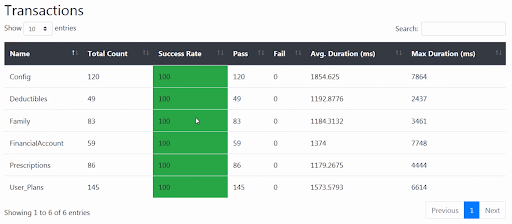
Other examples of customers using the NeoLoad APIs include heatmaps of pass/fail over time across project portfolios, custom trending based on a set of key transactions in and across systems, and even simple self-service portals to help development teams see how critical modules are performing, like so:
Reduce cognitive thrash in performance data with SLAs
Performance data must be easily consumed and domain-specific. The more of it and the more often you have to look at data, graphs, and charts, the greater the likelihood you will get desensitized to essential indicators. Many teams making the switch from other monolithic performance products to Tricentis NeoLoad have heard from their developers that a big, impersonal PDF report of load testing results from a load testing tool they don’t use doesn’t help them. Digging through statistics to get to meaningful insights shouldn’t be what product teams spend their time on.
In some organizations, raw test results continue to be piped through an “analysis process,” usually a manual set of export/import steps via semi-intelligent spreadsheets requiring the copying/pasting of charts and graphs into a final slide deck (not easily machine-readable). Although sometimes elements of this process are necessary, particularly when there’s a recurring anomaly (in mostly automated processes), doing this every time for each new build is just insanity.
A better approach is to break the process apart (like any good engineer does), identify which parts are easiest to automate, which parts take the most time, and those blocking the automation of the full end-to-end process. As you do this, you learn where critical context differs by project, how to extract that context early, and how to let people know the moment performance within that context deviates from expected norms.
An important part of performance testing is to establish SLAs and imbue them into your load tests. Each environment may have different variances and therefore different SLAs, but still, NeoLoad makes it easy to express SLAs as code:
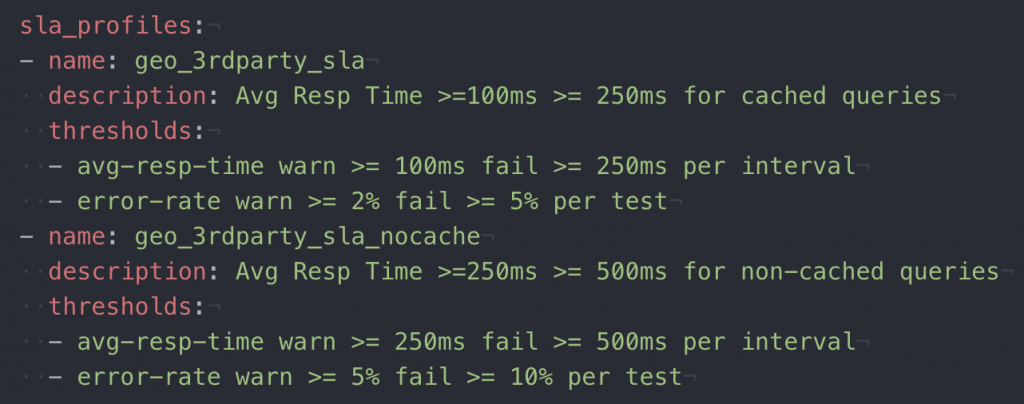
Unlike functional tests that suffer from occasional performance outliers, NeoLoad SLAs can be configured to calculate per interval/test, providing triggering time flexibility.
Once these SLAs are layered together with other elements, be it from a graphical designer or YAML-written (after a test is executed), it’s pass/fail, and threshold data will be available from the NeoLoad APIs via the [/tests/{testId}/slas/…] endpoints.
Another cool feature of the NeoLoad APIs is that they include graphing endpoints such that you can generate meaningful images for an automated notification (i.e., Slack) and customize the graph’s data:
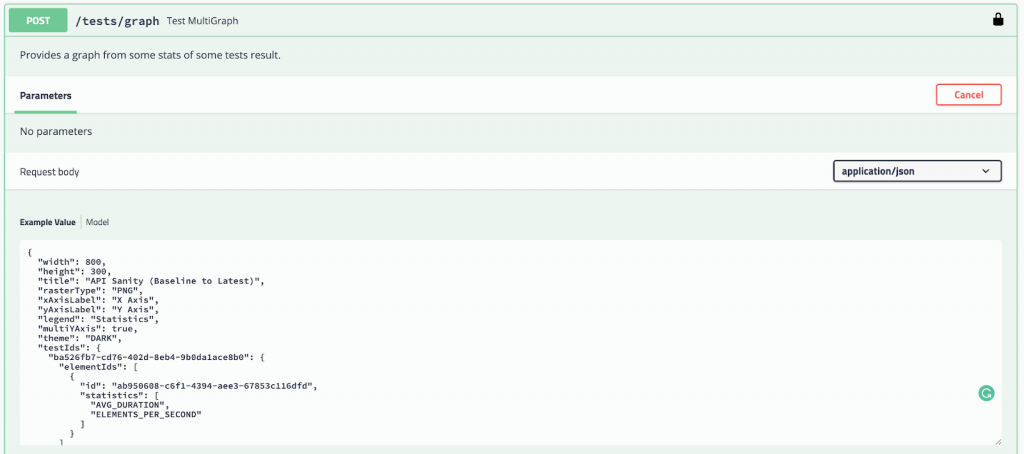
to produces the PNG output…
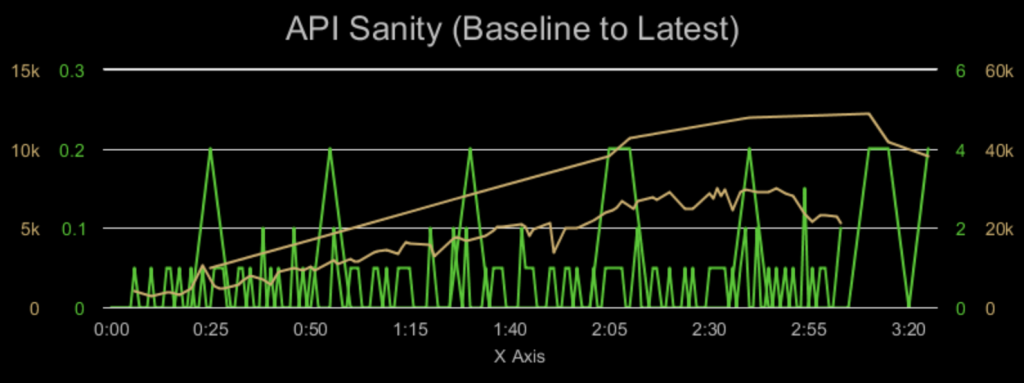
You can quickly turn what used to be a complex analysis process into more discrete automatic notifications to product teams when SLAs are violated during performance tests.
The post was originally published in 2019 and was most recently updated in July 2021.

