This article is the second in a multi-part series on how to enable performance testing to fit into continuous performance testing and automated pipelines seamlessly.
Part 1: Continuous load testing using Jenkins pipelines and Kubernetes
Part 2: 3 Killer anti-patterns in continuous performance testing
Part 3: Accelerating performance analysis with trends and open API data
Key takeaways from Part 1:
- Store all your assets: code, test artifacts, pipeline, config, etc. using SCM (e.g., Git)
- Develop common branching/tagging strategies that align across all your assets
- Branch before you start debugging CI testing/reconfigurations, then merge back
At Tricentis NeoLoad, we work with a lot of diverse teams around the world. Not every company implements performance engineering practices at the same volume level or time intervals along the software development lifecycle. That’s okay. The important thing to keep in mind when making decisions about your Agile, DevOps, or otherwise overgrown software forest journey is “What gaps will prevent us from progressing beyond what we’ve already decided as imperative to do?”
Many have decided that building sustainable automated and continuous processes across the entire lifecycle, including performance engineering and testing, is a modern imperative.
Avoid “hurrying up just to slow down” syndrome
There are a million causes of why we waste time. “Rework” isn’t the only category in your value streams, not even close. Agile and iterative product teams often build prototypes to learn about the problem and to produce a useable product. While we could all improve planning and requirements gathering, we often find ourselves blocked from closing out work items by unanticipated dependencies and misaligned expectations.
In performance testing, numerous things must be in place to get started: non-functional requirements/criteria, testing environments, system/service specifications, clear definitions of Service Level Objectives (SLOs) aligned across product, development, and operations teams, test data, etc. These are usual suspects, but how is this different when you begin to implement performance testing in continuous delivery processes?
From all of our experiences with customers and partner teams, here are a few key lessons we’ve learned about what needs to be in place to ensure your journey doesn’t start with critical blockers:
- Test storage, branching, and versioning should match the development and operations patterns and cycles (e.g., feature work, sprint hardening phases, etc.)
- A clear glide-path for promoting changes in test artifacts during sprints to release-ready branches used in continuous integration and orchestration platforms
- Debugging issues during testing and differentiating actual system defects from testing and deployment process problems
Let’s start with the first blocker — your test storage strategy.
Developers demand a performance “dumb button,” and that’s fine
Before you can wrap a performance test into a continuous build process, it needs to be fully automated. But what does that mean for load testing an API?
Your performance tests need to be somewhere that your automated CI job can access clearly and quickly. Many organizations have already switched to some form of Git-compliance source code management (SCM) system: GitLab, AWS CodeCommit, Azure Repos, Bitbucket, etc.
Consider that storing your performance tests in a monolithic silo such as Micro Focus Performance Center isolates performance engineering activity from the rest of your modern automated lifecycle (ALM) in CI tools (e.g., Jenkins, TeamCity, Bamboo, Digital.ai Release, née XebiaLabs XLRelease). This approach makes performance testing activity something that only a select few are capable of doing.
Some simplified processes encourage autonomy, some don’t
We recently met with the DevOps/cloud engineering, scalability, and performance team at an F20+ organization moving off of all Micro Focus products. While they elaborated on their current experiences to provide greater autonomy to their app and service development teams by creating deployment playbooks to spin up various tech stacks for Go, Node.js, and Java-based systems, they had a fantastic point — making something easy for someone also makes it hard for them to learn how to fix things if they go wrong.
We know this issue well. Customers who don’t know Docker or Kubernetes ask for things like native OpenShift integration to make spinning up load controllers and generators a seamless task. Many automate their analysis process using our REST APIs for test execution, real-time fast-fail determination, data extraction, and streaming to visualization tools like Splunk, Kibana, and Prometheus. They build these so that developers can press a “dumb button” in, say, Jenkins, and get actionable performance results.
Simplifying Git semantics for non-CLI savvy folks
That’s why Tricentis NeoLoad provides direct integration with Git sources, so everyone can collaborate on the details of performance tests, version their changes in a manner that matches feature/sprint branching in development source code, and execute them from anywhere, all in a matter of minutes — not hours.
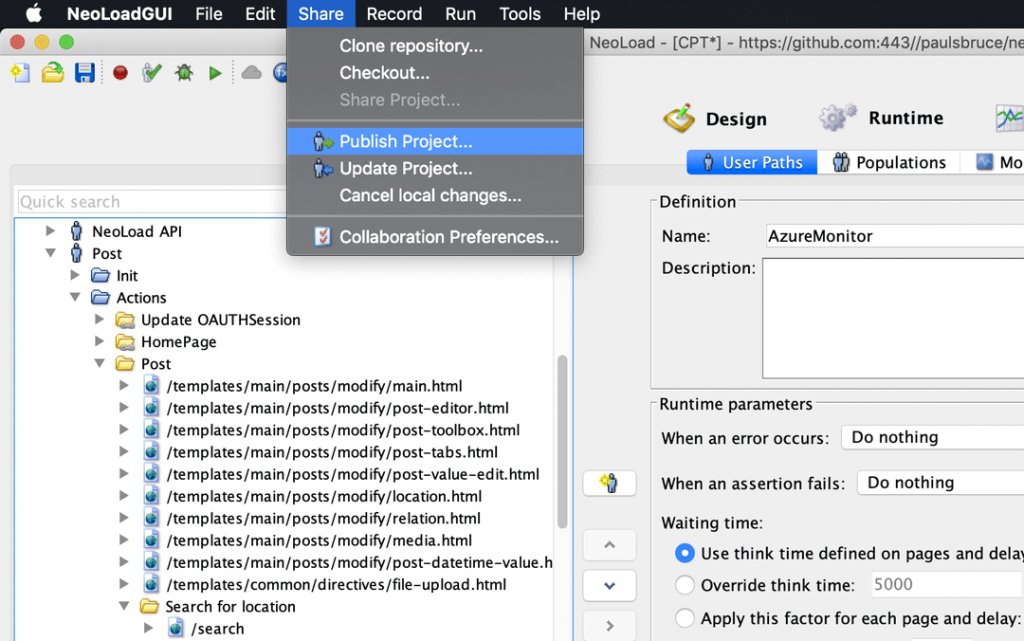
Git in NeoLoad encourages both autonomy and collaboration between engineers at all levels.
For contributors unfamiliar with Git command-line interface (CLI), Git capabilities in the NeoLoad desktop workbench simplify things, making it easy to clone, modify, push to a particular branch, and eventually merge with (and promote) those changes to other mainstream CI/CD events.
NeoLoad also supports all-code-based YAML descriptions of load tests. Regardless of the method for test construction and maintenance, via a graphical interface on a workstation or with the IDE or code editor of your choice, NeoLoad accelerates API load testing and SLO alignment across teams by visualizing and agreeing on performance expectations early on in cycles.
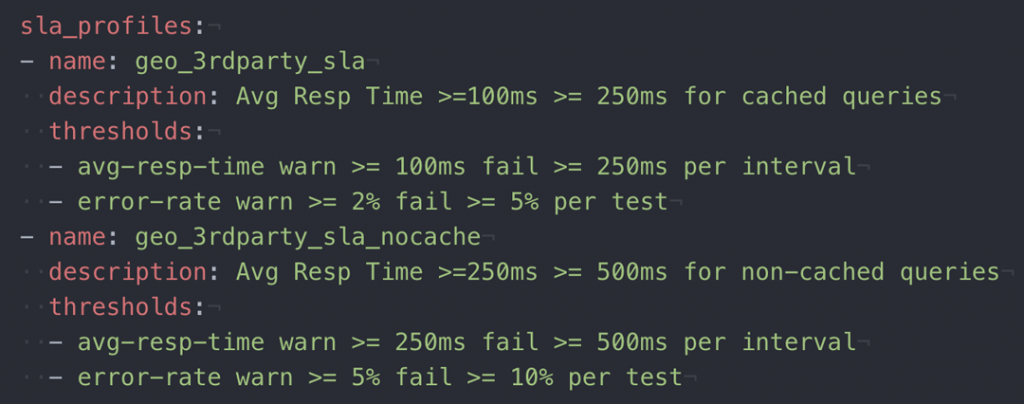
Now, let’s turn to the topic of what to do with these versions and branches — “test promotion” in CI.
Avoid hitting every branch on the way to production
We want our code in production because that’s where it makes money. Performance testing is vital to this process, namely because you don’t want to ship lousy code that fails in front of users. But this kind of testing comes with versionable artifacts that must match the app or service code you’re testing.
These assets should be in lockstep with each other. When multiple teams and features are flying out the door simultaneously, how do you ensure that versions are the same across code and test assets? Do you tend to “test all the things” as some vendors use as marketing-speak?
One ubiquitously implemented answer to this question is to use short branches in Git to simplify verification and validation of changes to testing and automated processes definitions.
Branching accelerates test promotion
Although trunk-based development is lauded as a preferred continuous delivery strategy that encourages small, frequent changes that are worthy of committing to one consistent codebase (and that’s a commendable goal), consider that branching has a vital role to play in the semantics of moving from works on your machine to those in production, even in this approach. Other code integration models such as Gitflow and stream-based version controls also inherit this problem, which in most cases is addressed by using continuous integration and orchestration platforms to remove the code from your local machine and reproduce the end-to-end assembly, testing, packaging, deployment, validating, and releasing semantics on (usually) hermetic environments.
For performance tests in CI, pipelines are often constructed such that humans or other processes (e.g., other master pipelines, JIRA, webhooks, and chatbots) can trigger them with automation. You build, get them working for test suites that match the current version of your app or service, then what? The code/environment configuration changes and tests similarly have to change as well. You’ve already got working pipelines and tests on the working version, how do you verify that the proposed version of the software and the new tests work too?
The answer — version your new code and tests together, perhaps using branches named the same across app and test repositories, or possibly using Git tags that match between these assets. Either due to feature work or in-sprint-based performance testing, you might clone the current working test suite, modify it and run local load tests, then check it into a new branch and have your pipelines run that branch of test assets on the latest version of the services in a pre-release environment. You may even version your pipeline code right alongside all these assets so that once you prove that everything’s working, the promotion (e.g., merge) of these branches in various repositories happen simultaneously.
Case study: Fortune 20 SREs building scalable CI conventions
In the conversation previously cited, I asked the DevOps engineers what represents some of their most painful work. Almost unanimously, they told me that it’s pattern and convention building across multiple cloud platforms. While they hadn’t deployed containers internally in a scalable way yet, between moving to Microsoft Azure, existing Pivotal Cloud Foundry, huge amounts of VMware automation, and Google Cloud Platform, the idea of creating playbooks for development teams and helper scripts to deploy new services was much of their team’s daily challenge.
What was different in this case was that they were using TeamCity and eventually CircleCI to automate these playbooks, in essence allowing the goal of being fully automated to drive the motion to improve their entire organization’s practices. They had Tricentis NeoLoad around because, in their opinion, the NeoLoad platform was the only load testing and performance solution that could fit all enterprise aspects of their modern, legacy, and hybrid apps using this automated model. Git support, access to data via open RESTful APIs, and flexibility to run tests whenever, wherever they want, suited their needs nicely.
As they scaled up these patterns across various cloud and container providers, automated pipelines that used simple configuration toggle to control unit, integration, functional, regression, and performance testing execution allowed multiple development teams to comply at a high level with risk requirements. Of course, a boolean toggle needs tests and data to complete, so they created convention-based repository and directory structures which the SRE team could expect in each pipeline project to contain these project-specific artifacts. This leaves it to development and performance engineers to use NeoLoad Git and YAML-based test projects to elaborate on test semantics and goals together.
Ignore the urge to fix test issues in the “master” branch
When performance tests fail, understanding why they failed is critical not only for traditional deep-dive analysis processes but to inform automated go/no-go indicators in pipelines as well.
The difficulty comes when teams don’t feel like they can trust these pass/fail warning flags.
Being able to determine which part of your automated process needs fixing is critical to keeping them up and running. In our experience, having separate versions of pipelines to diagnose issues helps engineers fault-isolate, correct, verify, then integrate their changes back into the production version of the automated process.
The number one reason we’ve seen continuous performance testing fail is when people who haven’t learned the value of testing their changes — neglecting to update these pipelines inadvertently makes them seem flaky or broken.
Branch before changes; rapidly drive to mergeable fixes
Before you make changes to your tests, automation/pipeline code, or infrastructure descriptions (Dockerfiles, Kubernetes deployment files, Chef scripts, etc.), create a new branch. They’re cheap, disposable, and hopefully, short-lived.
However, this creates a problem for classic monolithic automated pipelines: do you have to create “candidate” copies of all your CI jobs and configuration? The answer is “usually not.” Take, for instance, Jenkins multibranch pipelines, which allow you to point to a single repo but maintain separate pipelines per branch automatically.
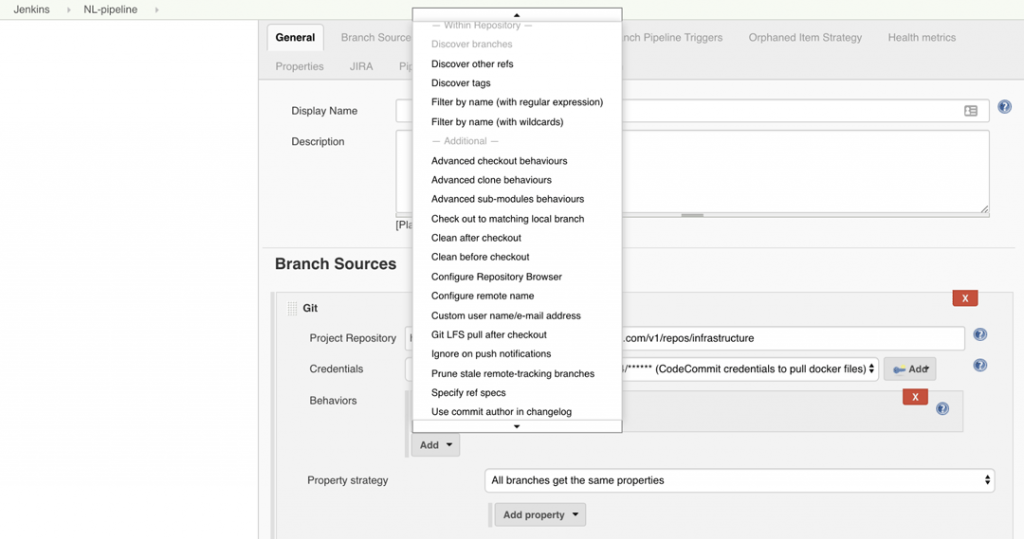
When also configured with support for Pull/Change Requests, you can create workflows that allow test reconfiguration and validation to occur separately from the production version of the pipeline until a final fix is known to work and ready for the rest of the teams to run.
Differentiating between “hard” and “soft” failures
Performance tests contain lots of data, and not every failure means the same thing. Here are some of the top reasons why they fail:
- Your app/service can’t handle the pressure of the load test
- The load infrastructure provisioned can’t perform the test
- One or more service level objectives (sometimes called SLAs in tooling) are violated
- Networking or connectivity between load infrastructure and target system(s) is faulty
- Validations to prove the complete transactions fail (as they should)
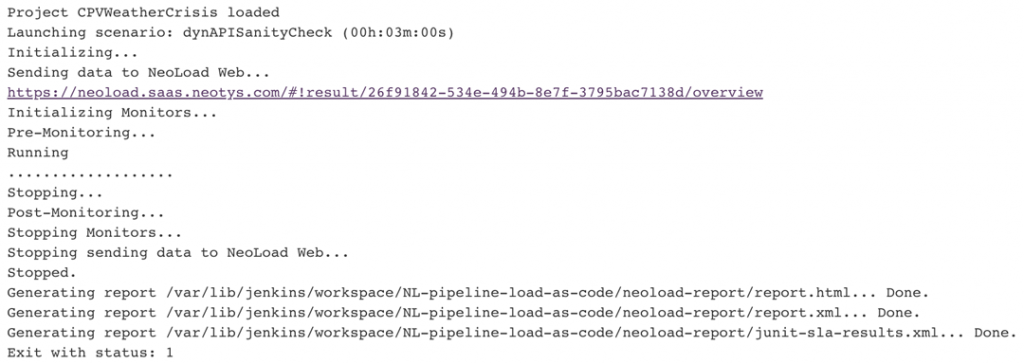
In each of these cases, a high-level go/no-go indicator used by your CI job is essential, but also insufficient to diagnose what happened and if something needs to be fixed. For instance, process indicators such as NeoLoad’s command-line interface (CLI) exit codes provide early failure level detail to inform pipeline try/catch and orchestration event semantics. In this first example, the test was successfully executed, but a few critical SLA violations occurred:

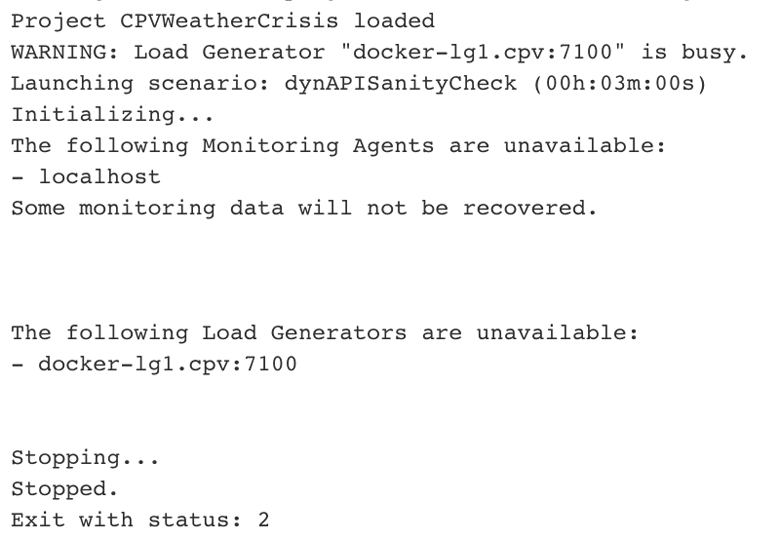
In this second example, our load infrastructure (Docker-based Jenkins build nodes) had some issues attaching to Jenkins due to new security constraints, thus invalidating the test entirely:
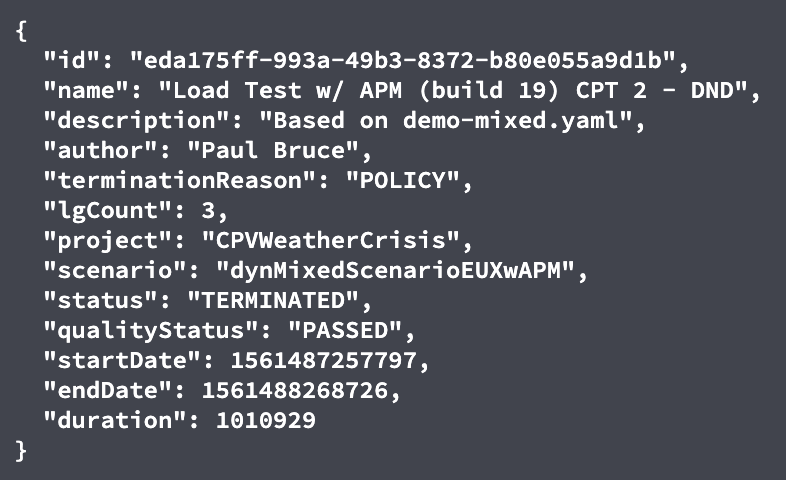
Going further, NeoLoad API summary data can be used to determine success or failure context:
Additionally, specific SLA data can be retrieved in a similar fashion from different API endpoints:

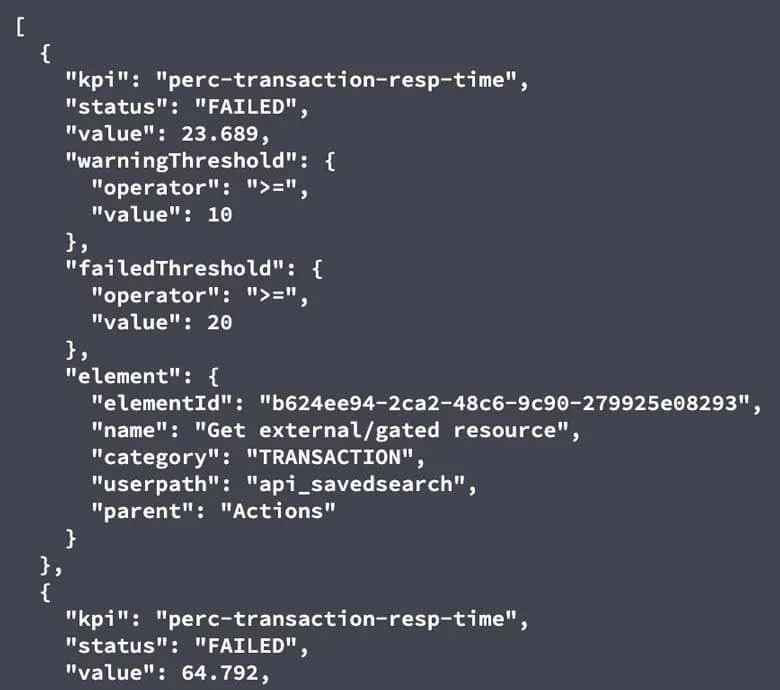
With the right level of detail on hand, even in a simple bash script with curl, teams can quickly identify the most significant contributing factor to why pipelines might not be working. Small, understandable changes to these automation artifacts will save you a ton of time in the end.
Next: Modern Fast Feedback Loops, Analysis, and Trending
In the final article of this series, Accelerating performance analysis with trends and open API data, we look at what putting continuous performance practices in place gets you. In short, better systems, faster fail/fix cycles, and less technical debt.

